ResearchMental Health
Male suicide trends by class and occupation

Summary
As we at the American Institute of Boys and Men have highlighted in much of our work, deaths from suicide are four times higher among men than women. However, there are big differences by class and occupation. Men without bachelor’s degrees are more than twice as likely to die by suicide as men with degrees, and there is also a class difference—though smaller—for women. The class differential is related to occupations; jobs where workers are less likely to hold degrees are also the occupations with higher suicide rates. Addressing and studying why these differences exist, and then tailoring preventions to fit the occupation, could potentially reduce the risk of suicide for those in these positions.
Key takeaways
- Men without bachelor’s degrees are more than twice as likely to die by suicide compared to men with degrees (36 versus 17 deaths per 100,000).
- The suicide rate among men without bachelor’s degrees has risen twice as fast as for college-educated men: a roughly 53% jump compared to a 26% increase for men with a bachelor’s.
- Men are more likely than women to die from suicide across occupational groups.
- Of all workers, construction workers are the most likely to die by suicide. The United States loses about five times as many construction workers to suicide as to workplace deaths on construction sites.
- Other occupations with high rates of suicide among men include installation, repair, and maintenance; farming and fishing; and protective services, which includes policing.
Class differences
Suicides in the United States skew disproportionately male, but there are differences by race, geography, family situation, as well as by class and occupation. In this brief we focus on these last two.
While suicide rates have risen for both men and women across education levels, the starkest jump has been for men without a bachelor’s degree: from about 24 deaths per 100,000 in 2000 to about 36 deaths per 100,000 in 2023. This is around a 53% increase in 23 years. That compares to a roughly 26% rise for college-educated men from about 14 to 17 deaths per 100,000.
Around 33,000 men aged at least 25-years-old died from suicide in 2023, and about 27,000 of them were men without bachelor’s degrees. The educational split is similar for the roughly 9,000 female suicides, with about 6,000 of them were women without bachelor’s degrees (author’s calculations from CDC mortality data; counts not shown in figure). This means that in terms of relative risk, men without a bachelor’s degree are about twice as likely to die from suicide compared to men with degrees (36 compared to 17 deaths per 100,000), as shown in figure 1.
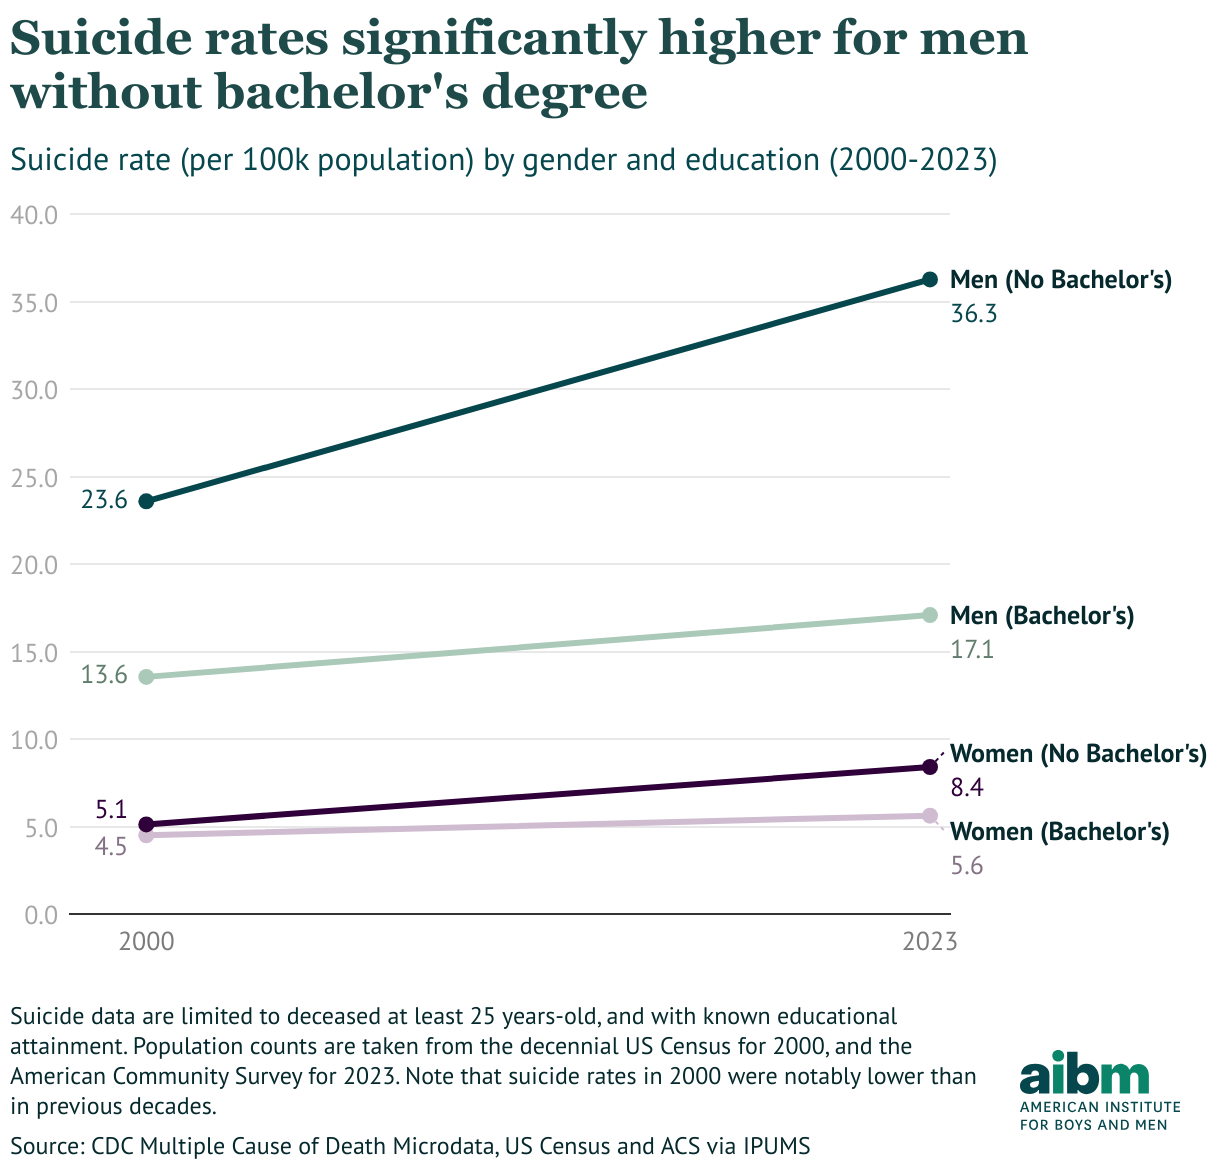
Figure 1
Data noteData used in this brief come from the following sources:
- National Vital Statistics System Public-Use Mortality Microdata: the CDC’s NVSS 2023 mortality microdata includes data on observed deaths in the United States, including a variety of demographic variables like educational attainment and occupation. We use the (broader) two-digit occupational group codes, based on US Census occupational coding, to calculate rates for these groups. For detailed occupational rates, we use the four-digit occupational codes, which are based on the Census’s 2018 occupational codes.
- Bureau of Labor Statistics Employment Counts: the BLS, using Census Current Population Survey (CPS) data, estimates the employed population by sex, age, and occupational group. We use these estimates to calculate occupational group suicide rates.
- American Community Survey Employment Counts: the ACS estimates the employed population by sex, age and detailed occupation, which we use to calculate suicide rates by detailed occupation. Specifically, we use tables B24115 and B24116, which represent estimates for men and women, respectively, from the 2023 ACS 1-Year estimates.
This analysis is subject to several of the same limitations noted in the CDC’s earlier review:
- The mortality microdata includes information on a person’s usual occupation, while the employment estimates only represent estimates for those currently employed, meaning a mismatch between the numerator and denominator when calculating rates. Further, there is a chance for mismatches in occupation due to misclassifying the occupation of the deceased.
- A small portion of suicide death records in the microdata (about 1%) do not include information on usual occupation, which means suicide rate estimates for some occupations may be underestimated.
- There is a further (albeit small) mismatch in calculations, as suicide counts are for men and women aged at least fifteen years old, while employment counts include men and women aged at least sixteen years old.
- Given the nature of the data, we estimate the difference in suicide rates between occupational groups, not between individual workers. For example, though construction workers are more likely to die by suicide than managers, we cannot say that becoming a construction worker increases one’s risk of suicide, or that any individual construction worker is at a greater risk of suicide than any individual manager.
Given the year-to-year variation in suicides, as well as the small population counts in a number of occupations, rates by detailed occupation and gender can vary dramatically from year to year. For example, if 10 more male boilermakers died by suicide, the male rate would increase from 136 per 100k to 202 per 100k; if 10 fewer died, it would decrease to 72 per 100k. For this reason, in figure 3, we include both raw suicide counts along with employed population counts.
Suicide rates are much lower for women overall, and there is a smaller difference by education, with about 8 suicide deaths per 100,000 women without a degree, compared to about 6 per 100,000 for women with a degree.
Occupational differences
There are also differences in suicide risk by occupation. A paper from the CDC, using 2021 mortality data, found a number of occupational groups with notably higher suicide rates, such as construction, farming, personal care, and maintenance and repair. But the interaction between gender and occupation has not been subject to as much analysis.
Using the most recent public-use mortality microdata (2023), we calculate suicide rates by both gender and occupation groups, for all ages. In 2023, the occupational group with the highest suicide rate, by a large margin and for both men and women, was “construction and extraction,” as shown in figure 2. The suicide rates for men and women working in this sector are roughly 69 and 22 deaths per 100,000, respectively. In absolute terms, this equates to about 5,600 deaths a year from suicide. For comparison, around 1,000 construction workers died at the workplace, meaning that construction workers in 2023 died by suicide at about five times the rate as on the job (author’s calculations from CDC mortality data; counts not shown in figure).
Given the differences by education in suicide, it is unsurprising that the occupations with the highest suicide rates are those that are less likely to require a bachelor’s degree to work in them. These are also mostly male-dominated sectors.
Overall, men’s suicide rates are about three times higher than women’s across occupational groups. The largest difference in suicides, measured by ratio of male and female rates, is in “farming, fishing and forestry” (48 men versus 9 women per 100,000; about 5.5-to-1), and the smallest difference is in “healthcare support” (31 men and 14 women per 100,000; about 2.3-to-1).
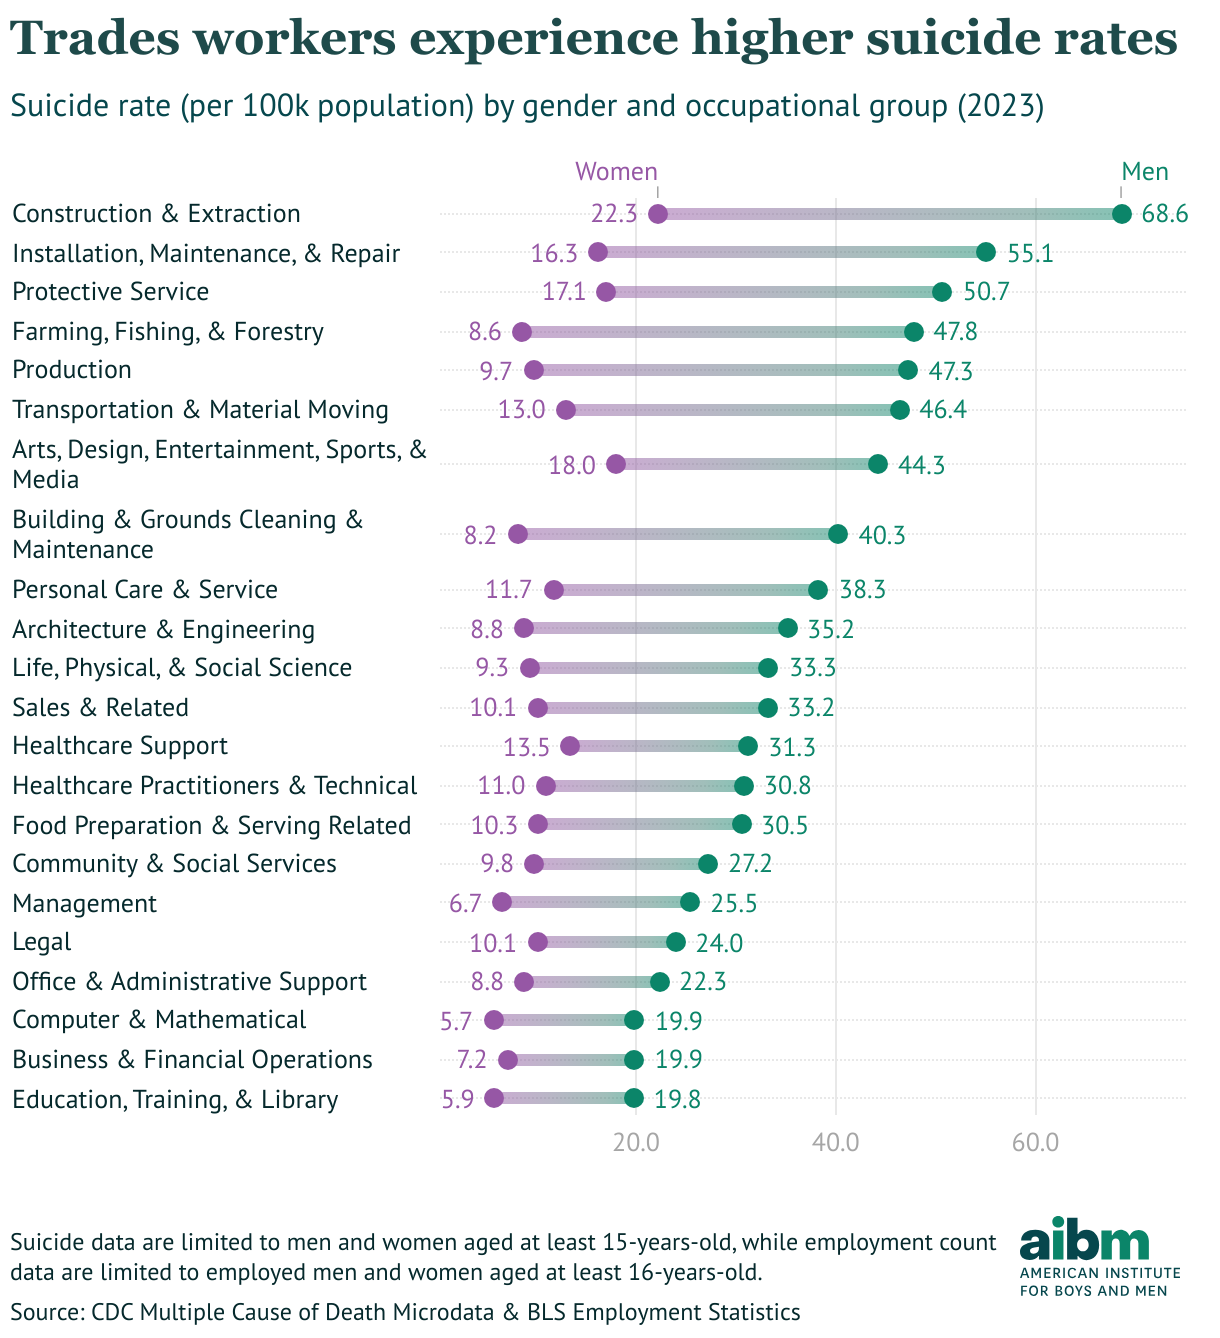
Figure 2
The five occupational groups with the highest suicide rates for men were the following:
- Construction and extraction: 69 deaths per 100,000 population (5,552 deaths)
- Installation, maintenance, and repair: 55 per 100,000 (2,580 deaths)
- Protective service: 51 per 100,000 (1,196 deaths)
- Farming, fishing, and forestry: 48 per 100,000 (344 deaths)
- Production: 47 per 100,000 (2,744 deaths)
For both men and women, the occupations with the lowest rates of suicide are “computer and mathematics” (20 and 6 suicides per 100,000 men and women, respectively), and “education, training, & library” occupations (20 and 6 deaths per 100,000).
The variation in suicide rates by more detailed occupation categories can be seen in the full searchable table of results shown in figure 3. For example, in 2023, male logging workers had a suicide rate of 146 deaths per 100,000; in comparison, male secondary school teachers had a rate of 7 deaths per 100,000. The more granular analysis also shows class differences within occupations, too. For example, the suicide rate among construction laborers is 96 per 100,000, twice the rate for construction managers (who are more likely to have a bachelor’s degree), at 48 per 100,000 (still a very high rate, however).
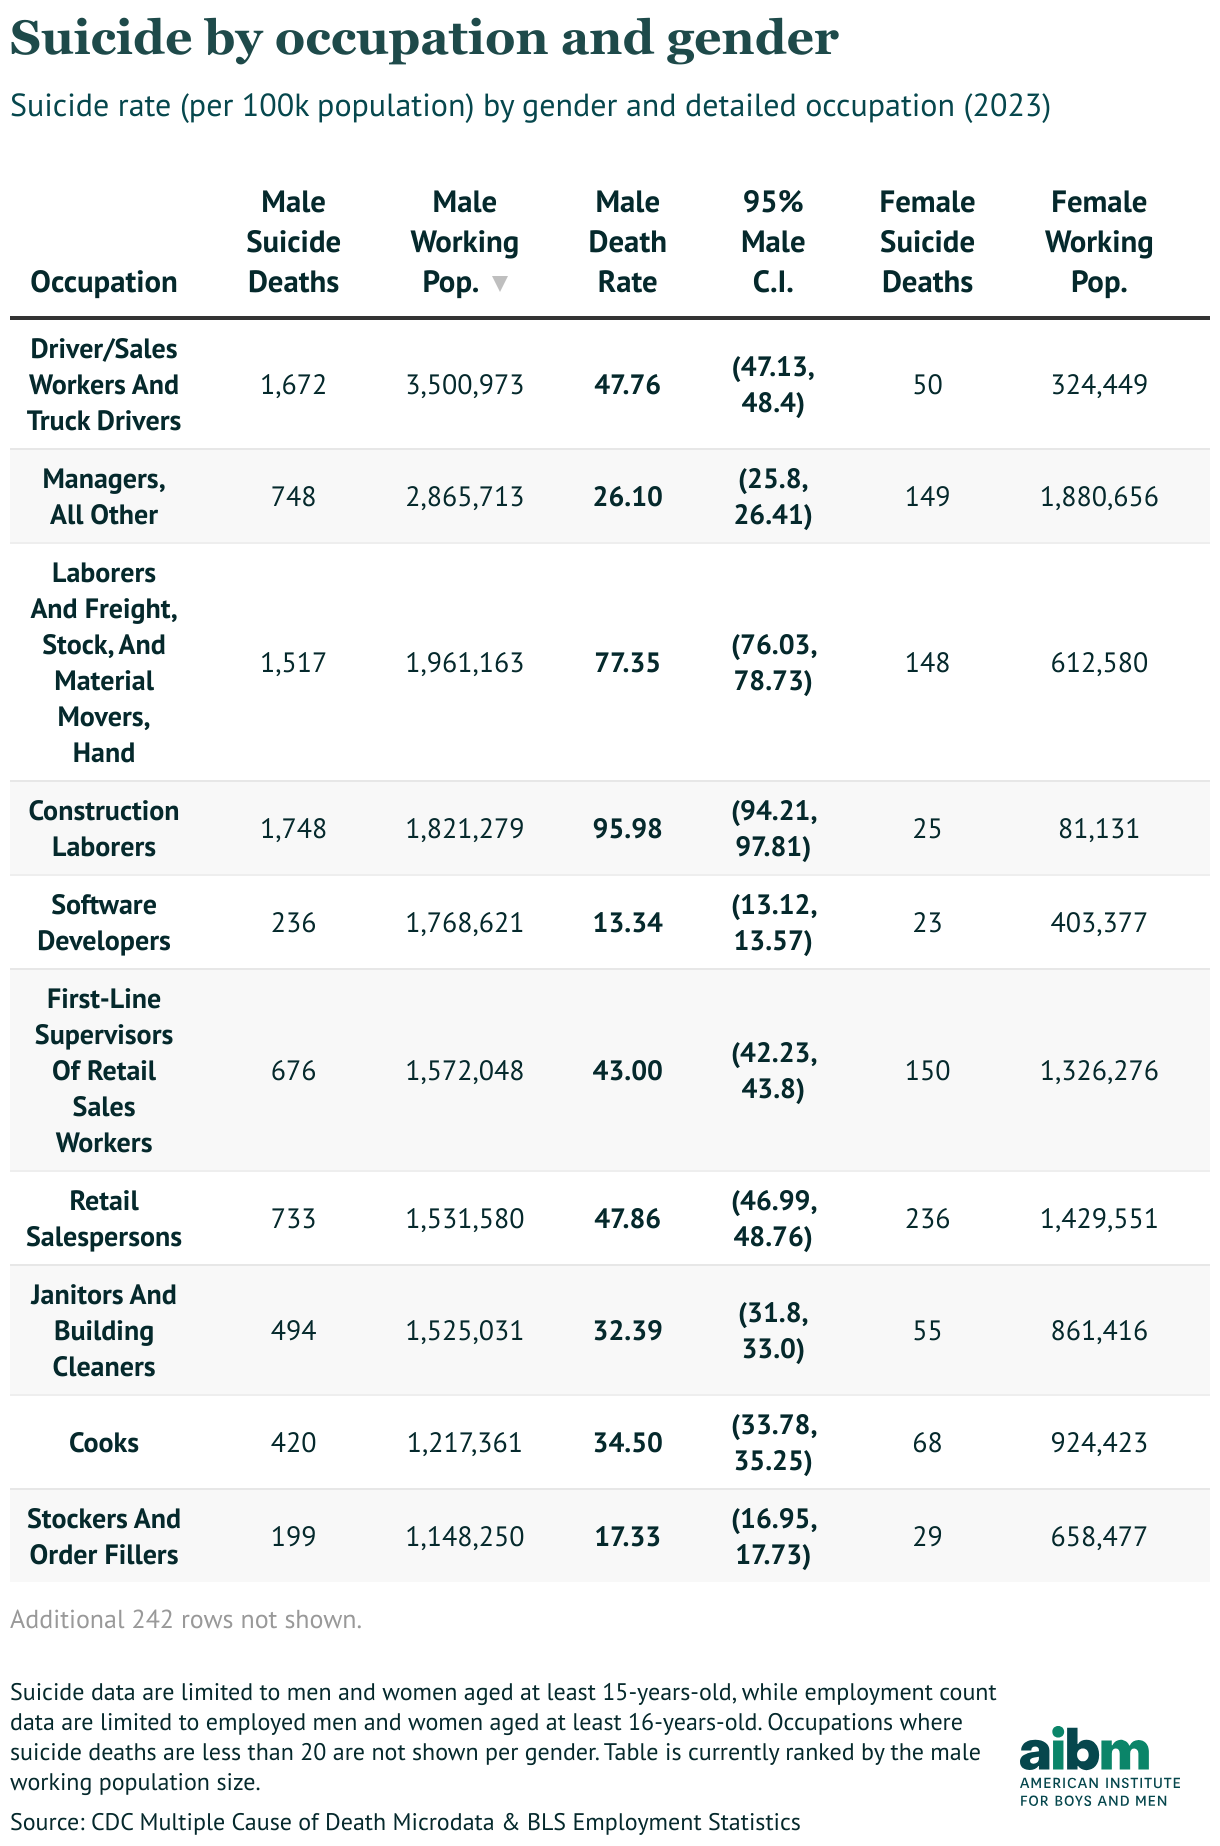
Figure 3
Industry taking action on suicide prevention
As we show here, working class men are at a heightened risk of suicide and have seen the sharpest rise in that risk in recent years. The industry is taking notice. Organizations like The Business Roundtable are convening initiatives on mental health. Specific industries with higher risks of suicide are also taking action. In construction, for example:
- The Construction Industry Alliance for Suicide Prevention was formed to “raise awareness about suicide prevention and provide resources and tools to create a zero suicide industry by uniting and supporting the construction community.”
- The Construction Suicide Prevention Partnership, started by the Oregon program Lines for Life, includes contractors, unions, insurers, OSHA, health companies and others aims to reduce suicide among construction workers by “promoting positive mental health messages, sharing practical tools to help the construction community create and sustain prevention efforts, and providing connections with effective prevention and intervention resources.”
- With a $7 million grant from Bechtel Corporation, the American Foundation for Suicide Prevention aims to reach 500,000 construction workers with industry-tailored programs, like the Hard Hat Courage program.
Deepening our understanding of the gendered nature of suicide risk in particular sectors is an important goal in its own right, and may also deepen our understanding of the growing crisis in male suicide in our society more broadly.
Subscribe to our newsletter
Get the latest developments on the trends and issues facing boys and men.
Related Research

Mental Health
Is it inevitable that men die younger than women? Looking at evidence and policy solutions
Allen Downey analyzes life expectancy and cause-specific mortality data across the United States and other OECD countries from 2000 to 2023 to understand how much the life expectancy gap between men and women varies, which causes of death contribute most to it, and where policy might be most effective.

Mental Health
Marijuana use among men hits new highs
Marijuana use is rising among U.S. men, especially ages 26–34, with higher daily use and cannabis use disorder rates than women.

Mental Health
What we know—and don’t know—about pornography and boys and men
Explore AIBM’s scan of pornography research—usage trends, effects, motivations, and key gaps shaping policy and evidence.