Research
Beyond half measures: How to improve gender gap indices

Key takeaways
- It is important to measure and highlight gender gaps in both directions, when boys and men are at a disadvantage relative to girls and women, as well as vice versa.
- Some studies such as the Global Gender Gap Report (GGGR) from the World Economic Forum take an asymmetric approach, counting only inequalities impacting women and girls.
- Revising the GGGR methodology to include gender gaps in both directions in OECD countries shows many domains where boys and men are worse off, especially in education and health.
- In 35 of 38 OECD countries there are more women than men enrolled in tertiary education, for example, often by a wide margin. In Iceland, ranked by the GGGR as the most gender-equal country in the world, the biggest gap under our revised methodology is the one in tertiary education.
- Gender gaps in healthy life expectancy vary significantly across OECD nations too, from close to parity in the Netherlands to a gap of 6 years in Lithuania, for example. But these differences are not captured in the GGGR, which treats a gap of 4-5 years in favor of women as equality.
- More comprehensive studies of gender gaps would be of value to policymakers who are concerned to address gender inequalities in both directions, alongside those focused on either boys and men or women and girls.
Contents
Motivational framework
Broader measures of gender gaps
Revisions
Economic participation and opportunity
Motivational framework
Introduction
Measuring gender gaps is challenging. For one thing, distributions overlap even when there is a gap at the average. In the U.S., median female earnings are 18 percentage points lower than male earnings, but 40% of women earn more than the median man. Women live five years longer than men on average, but 36% of men live longer than the median woman. Analyzing gender gaps across different subgroups also complicates the picture: white women now earn considerably more than Black men, for example (at the average, of course).
Another potential difficulty is whether to focus only on gender gaps in one direction. The term “gender gap” is typically used to show inequalities where women are worse off than men. Many institutions and scholars focus on these gender gaps. But of course many gender gaps run the other way; these gaps are highlighted by our own work at the American Institute for Boys and Men. This is appropriate in either case; different institutions have different focuses.
A question arises, however, when it comes to indices of gender gaps, especially when these are used for comparative purposes. The most comprehensive existing indices do not measure gender gaps in both directions, instead reporting only the gaps where girls and women are behind boys and men. One example is the World Economic Forum’s Global Gender Gap Report (GGGR) produced by the World Economic Forum (WEF). The GGGR is the most commonly cited measure of gender gaps across countries. It captures and synthesizes a vast amount of data, measuring gender gaps in 146 countries across four dimensions: Economic Participation and Opportunity, Educational Attainment, Health and Survival, and Political Empowerment.
But it is asymmetric. The GGGR explicitly discounts gender gaps disfavoring boys and men. This is by design, since the goal of the report is to focus on the position of women, rather than on gender gaps as such. As the authors of the 2025 report state, the purpose is to track “women’s empowerment”, not to measure “gender equality”. Again, this choice makes sense from an advocacy standpoint. If the goal is to focus attention on the gender inequalities faced by women and girls, there is no need to consider the gender inequalities faced by men and boys; indeed that might even be considered a distraction.
But there are large gender gaps where boys and men lag behind women and girls, particularly in education and health, and especially in advanced economies. Indeed, the biggest gender gap in Iceland, a country which consistently ranks at the top of the GGGR table, is in higher education, where men lag women.
Broader measures of gender gaps
There is a danger that the wide gender gaps impacting boys and men receive insufficient attention, especially if they are ignored in the highest-profile analyses of gender equality. This awareness gap could result in an empathy gap.
What’s the solution? Either:
- broaden the existing asymmetric gender gap measures to include gender gaps in both directions; or
- introduce new measures and reports focused solely on male disadvantages, to complement those which focus on female disadvantages.
The first approach was suggested by the Norwegian Royal Commission on Men and Inequality, which urged the Norwegian government to adopt broader, symmetrical measures of gender equality and for similar reforms among international organizations. The specific recommendation noted that “Norwegian authorities should take the initiative to revise the global indicator sets, both regarding which indicators are included and how they are weighted.”¹
Our view is that there is a case for both solutions. It will often make sense to draw attention to the specific challenges of girls and women or of boys and men. Much of AIBM’s work, by definition, focuses on the latter. See for example our joint report with the Boston Foundation on boys and men. If the U.S. creates an Office of Men’s Health, its reports will, of course, focus on health issues particularly impacting boys and men (just as the various offices of Women’s Health do already).
On the international front, this could mean creating parallel versions of indices like the GGGR, but focused solely on boys and men (and labeled as such).
But there is also a strong case for developing measures of gender equality that cut both ways, and offer a comprehensive picture of relative gender gaps. This would help draw attention to the gaps where policymakers should devote most attention, on behalf of both women and men. This case is especially strong for more economically advanced nations, such as those in the Organisation for Economic Co-operation and Development (OECD) or EU, since this is where the gender gaps disfavoring boys and men are most pronounced.
Adapting existing metrics
The good news is that new, symmetrical gender gap measures can largely draw on the data used for the existing female-focused ones, simply by changing the methodology. Here we attempt such an exercise by adapting the methodology of the GGGR so as to incorporate inequalities in both directions, as well as narrowing the scope to OECD nations.
Specifically, we:
- Describe the methodology of the GGGR — especially the “one-sided” approach to measuring gaps, the treatment of life expectancy, and the choice of a low literacy score — and present our revised approach.
- Recalculate scores in OECD nations to take into account gender gaps in both directions.
- Show our revised results for the subindices for:
- Educational Attainment
- Health and Survival
- Economic Participation and Opportunity
- Create revised overall gender gap scores and rankings for OECD countries.
Note that we do not make any revisions to the other subdomain, Political Empowerment, since here the gaps are consistently ones where women are still behind.
We show that:
- Including gaps where men are worse off reduces the overall gender gap score in virtually every OECD member country.
- The reduction is especially marked in those nations that score highest under the GGGR’s methodology, including the Scandinavian countries.
- Gender gaps in tertiary (post-secondary) education enrollment are much wider than most other gaps in most countries, and in some cases are the widest gap of all.
There is a growing recognition among policymakers that gender gaps matter in both directions. There is a strong case for developing gender equality measures that capture both, as well as those which focus on one gender alone.
Revising the GGGR methodology
For each country, the GGGR calculates the gap between women and men across a range of measures, and combines the results using a weighted average. The final score is intended to reflect how close each country is to achieving full gender parity.
Combining data across dimensions and reducing it to a single score requires methodological choices. Three in particular are noteworthy. For each, we will describe their approach, and then follow with our own revised approach.
A one-sided scale
First, for most indicators, the GGGR scores in a range between zero (complete inequality) and 1 (complete equality). But the scores are truncated at 1. In other words, gaps where women are behind men are counted, but gaps where men are behind women are not. For the GGGR authors, this one-sidedness is a feature of the approach, not a bug. As an appendix of the Report explains, the two different approaches were considered in the report’s original design:
One was a negative-positive scale capturing the size and direction of the gender gap. This scale penalizes either men’s advantage over women or women’s advantage over men and gives the highest points to absolute equality. The second choice was a one-sided scale that measures how close women are to reaching parity with men but does not reward or penalize countries for having a gender gap in the other direction.
The GGGR opts for the second, one-sided scale, which the appendix presents in more detail:
The ratios obtained above are truncated at the “equality benchmark” […] considered to be 1, meaning equal numbers of women and men. [Truncation] assigns the same score to a country that has reached parity between women and men and one where women have surpassed men.
The report explains that this choice “determines whether the index is rewarding women’s empowerment or gender equality” and concludes that the one-sided scale is “more appropriate for our purposes.” The GGGR is thus explicitly designed to measure women’s empowerment and not gender gaps. What this means in practice is that a nation would be considered to have achieved “gender equality” even if men were hugely disadvantaged compared to women, so long as there were no domains in which women lagged behind men. The implications of this are profound. A nation could have men collapsing in education, health, and workforce participation, yet still be rated as achieving gender equality, provided women weren’t worse off in any domain.
An assumed life expectancy gender gap
Second, the Health and Survival score assumes that in a gender-equal society, women have 6% more “healthy life expectancy” than men — a difference of 4-5 years. As the report explains:
[I]n the case of healthy life expectancy the equality benchmark is set at 1.06 to capture the fact that women tend to naturally live longer than men. As such, parity is considered as achieved if, on average, women live five years longer than men.
What this means is that in a nation where women have only 5% more years of life expectancy than men, rather than 6%, women are considered to be at a disadvantage on this measure.
It is true that women outlive men in almost every country. Causes of this difference include accidents, occupational hazard, risk-taking behavior, lifestyle and health choices, addiction, suicide, violence, and incarceration. But there is nothing fixed about this gap, as the GGGR assumes. In the U.S. the gap was less than two years a century ago. And as GGGR data shows (Figure 1), the gender gap in healthy life expectancy varies significantly between countries today.
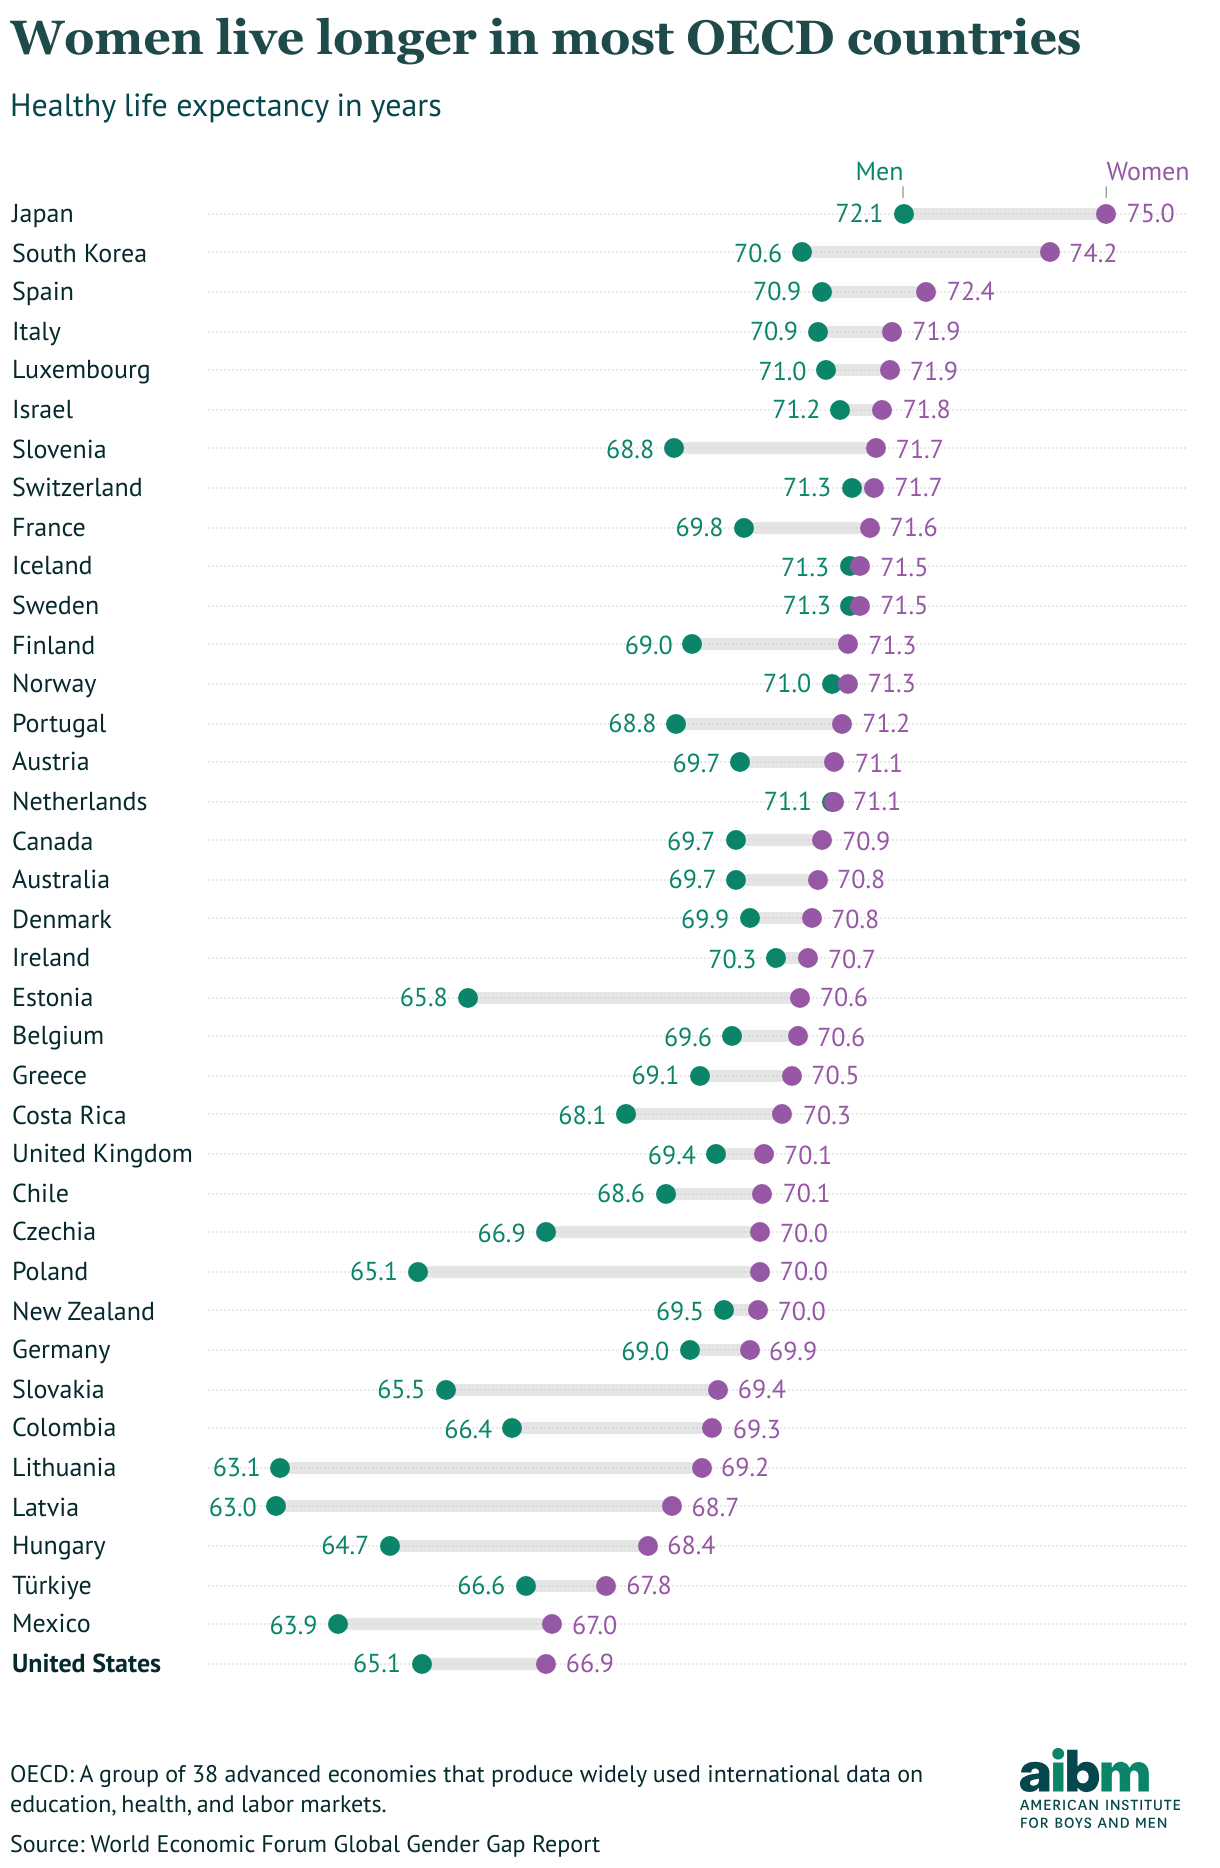
Figure 1
Women live longer than men in most countries, but the size of the gap varies. The ratio in most Northern European countries is between 1.0 and 1.1, which suggests that in places with high income, universal health care, and a social safety net, healthy life expectancy is close to equal for men and women. We will return to this issue in the section on Health and Survival.
It is worth noting that there is considerable variation in absolute healthy life expectancy across countries for both men and women, ranging from 74 years for women in South Korea down to 67 for women in the U.S., at the bottom of the OECD table.
A low measure of literacy
As a measure of literacy, the GGGR uses the “percentage of the adult population [over age 15] with the ability to both read and write and make simple arithmetic calculations,” drawing on data from UNESCO. This benchmark makes sense in less advanced economies. But in most OECD countries, literacy at this basic level is now almost universal. In fact, UNESCO no longer even collects these literacy scores in higher income countries.
Without data for those higher income countries on this indicator, the GGGR assumes that in all of these countries “the gender gap on literacy rate is closed.” But the gender gap has only “closed” in the sense that girls are not behind boys. There are in fact gender gaps in literacy in OECD nations, with boys falling behind girls, as we show below.
To be clear, there is an unavoidable methodological challenge in any attempt to compare very different countries using consistent thresholds. Given their focus on women, the GGGR authors make the reasonable decision to adopt a threshold that highlights countries where girls are behind boys.
Modifying the GGGR approach
We use the GGGR data to recompute gender gap scores for OECD countries, making three methodological changes:
- a symmetric treatment of all indicators (i.e. removing truncation at 1)
- equal consideration for the healthy life spans of men and women
- a literacy level more appropriate for advanced economies.
We find that for some indicators, such as education, these changes have a substantial effect on scores, because boys and men are faring worse than girls and women. In almost all OECD countries, the effect of our changes is to lower the overall equality score.
Revisions
Educational attainment
Many of the indicators that make up the GGGR are ratios comparing female and male outcomes, including education gaps. The four indicators in this dimension are adult literacy and enrollment in primary, secondary, and tertiary education.
In tertiary education the effect of truncating the indicator is dramatic. For example, in Kenya, about 18% of university-age women are enrolled in higher education, compared to 23% for men, so the score for this indicator is 18/23, or 0.78. In U.S. higher education, by contrast, women outnumber men by almost 1.5 to 1. In the GGGR methodology, this ratio is truncated at 1, so the U.S. gets a perfect score on this indicator — despite a gender imbalance that is actually larger than the one in Kenya, but the other way around.
In fact, in all but three of the 38 OECD countries, more women than men are enrolled in universities. In the GGGR, using the truncated ratios, all these countries get a 1 — that is, a perfect equality score. But when we recalculate scores without truncating, the results are markedly different.
Figure 2 shows the score reported in the GGGR for tertiary education in each OECD country and our revised scores (without truncation).
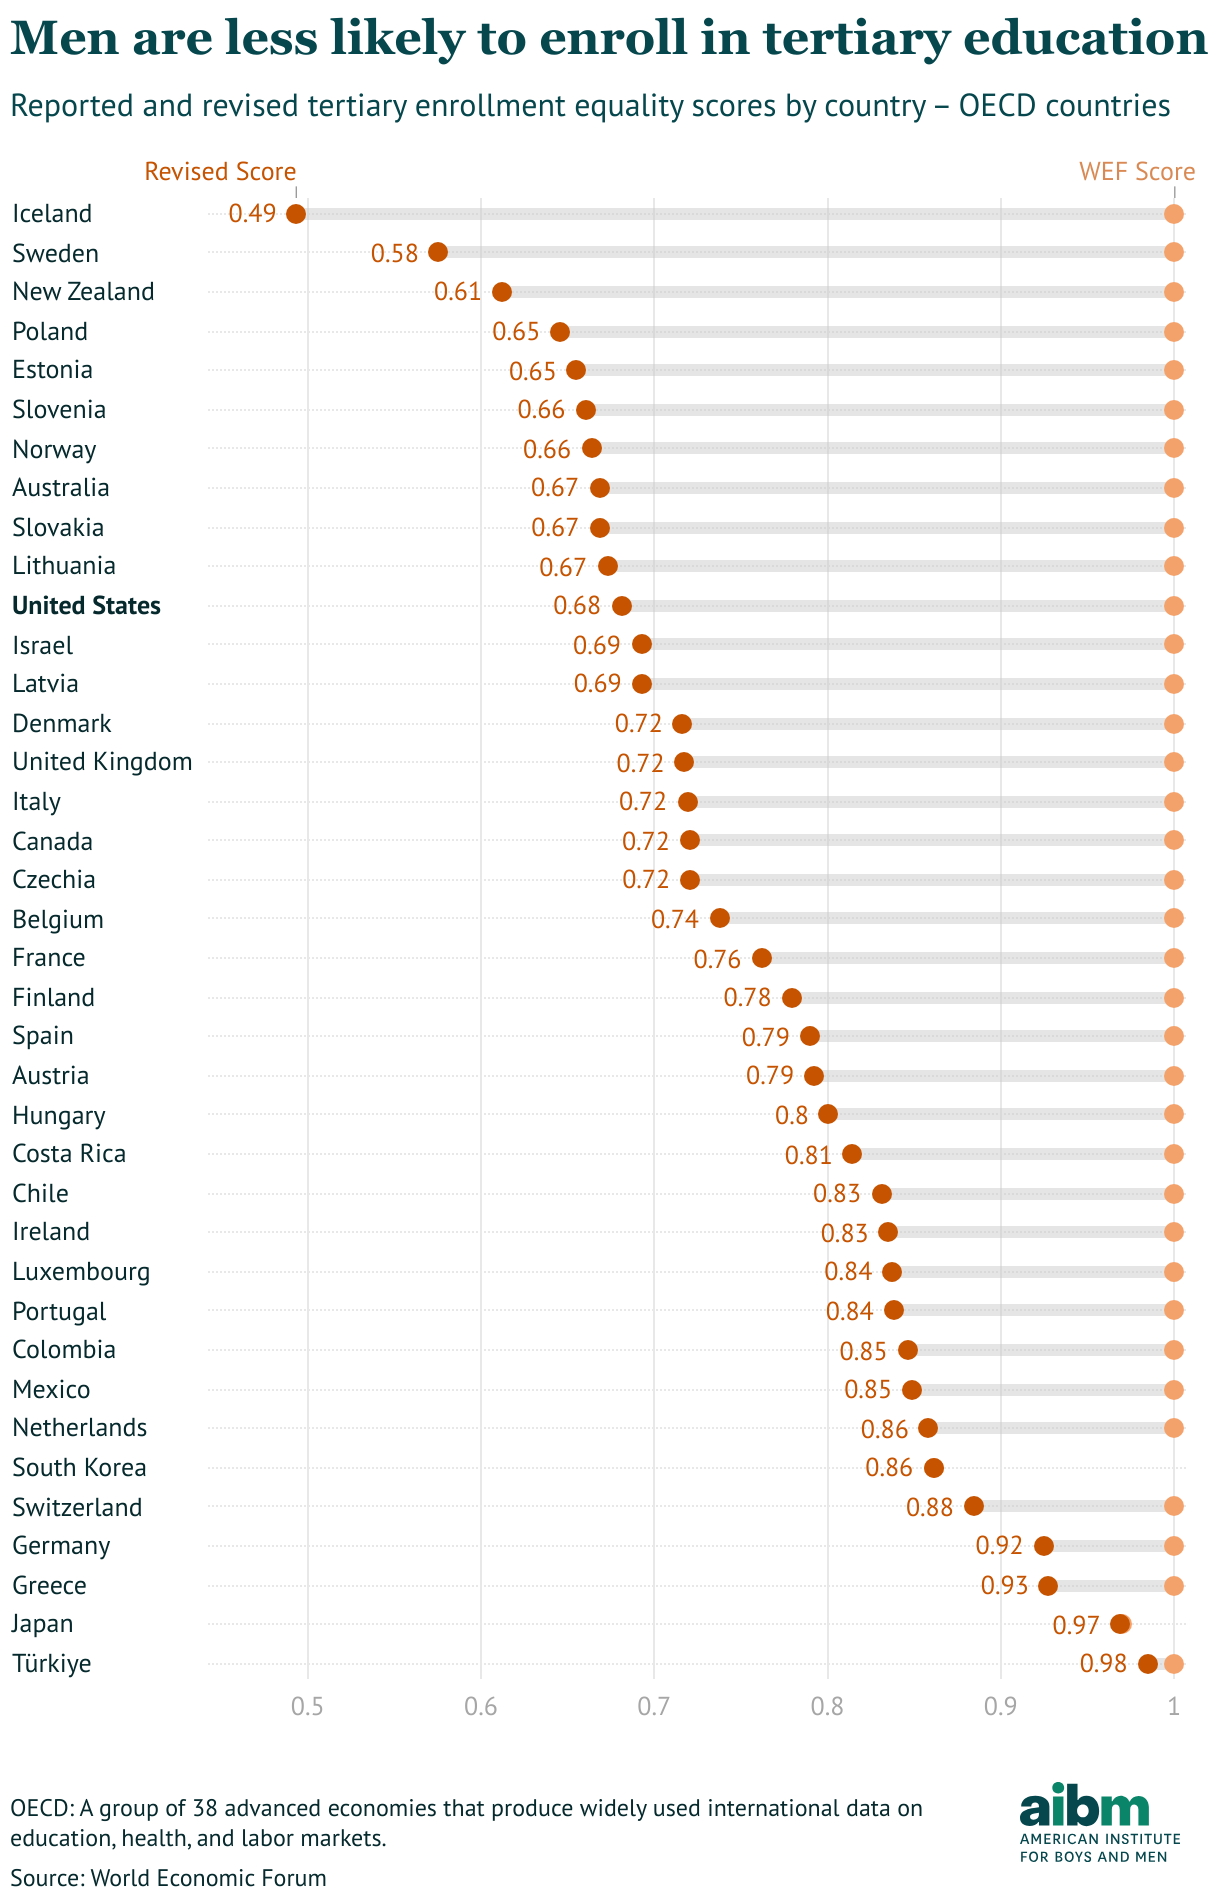
Figure 2
In all but two OECD countries (South Korea and Japan) the untruncated scores are lower, and in many cases significantly so. The difference is particularly large in Iceland, where almost twice as many women are enrolled in universities compared to men, so the score is 0.5. Under our revised methodology, this is the biggest gender gap in Iceland.
The results for secondary education are less dramatic. In most OECD countries, enrollment rates are similar for boys and girls, so the effect of truncation is small. Using untruncated ratios, only four countries score less than 0.9: Sweden, Mexico, Finland, and Costa Rica (not shown).
Similarly, enrollment in primary education is close to equal in most OECD countries, so the untruncated scores are only a little lower (not shown).
For literacy, we adopt a different benchmark than the GGGR, using data from the Programme for the International Assessment of Adult Competencies (PIAAC), part of the OECD Survey of Adult Skills. PIAAC measures literacy on a six-point scale from Level 0 to Level 5. We measure the percentages of men and women whose literacy score is above Level 1, described as follows:
Adults at Level 1 are able to locate information on a text page, find a relevant link from a website, and identify relevant text among multiple options when the relevant information is explicitly cued. They can understand the meaning of short texts, as well as the organization of lists or multiple sections within a single page.
Across OECD countries, about 75% of adults exceed this threshold but in almost all cases, more women than men exceed this standard. Figure 3 shows the difference between the GGGR’s presumed perfect scores with our ratios:
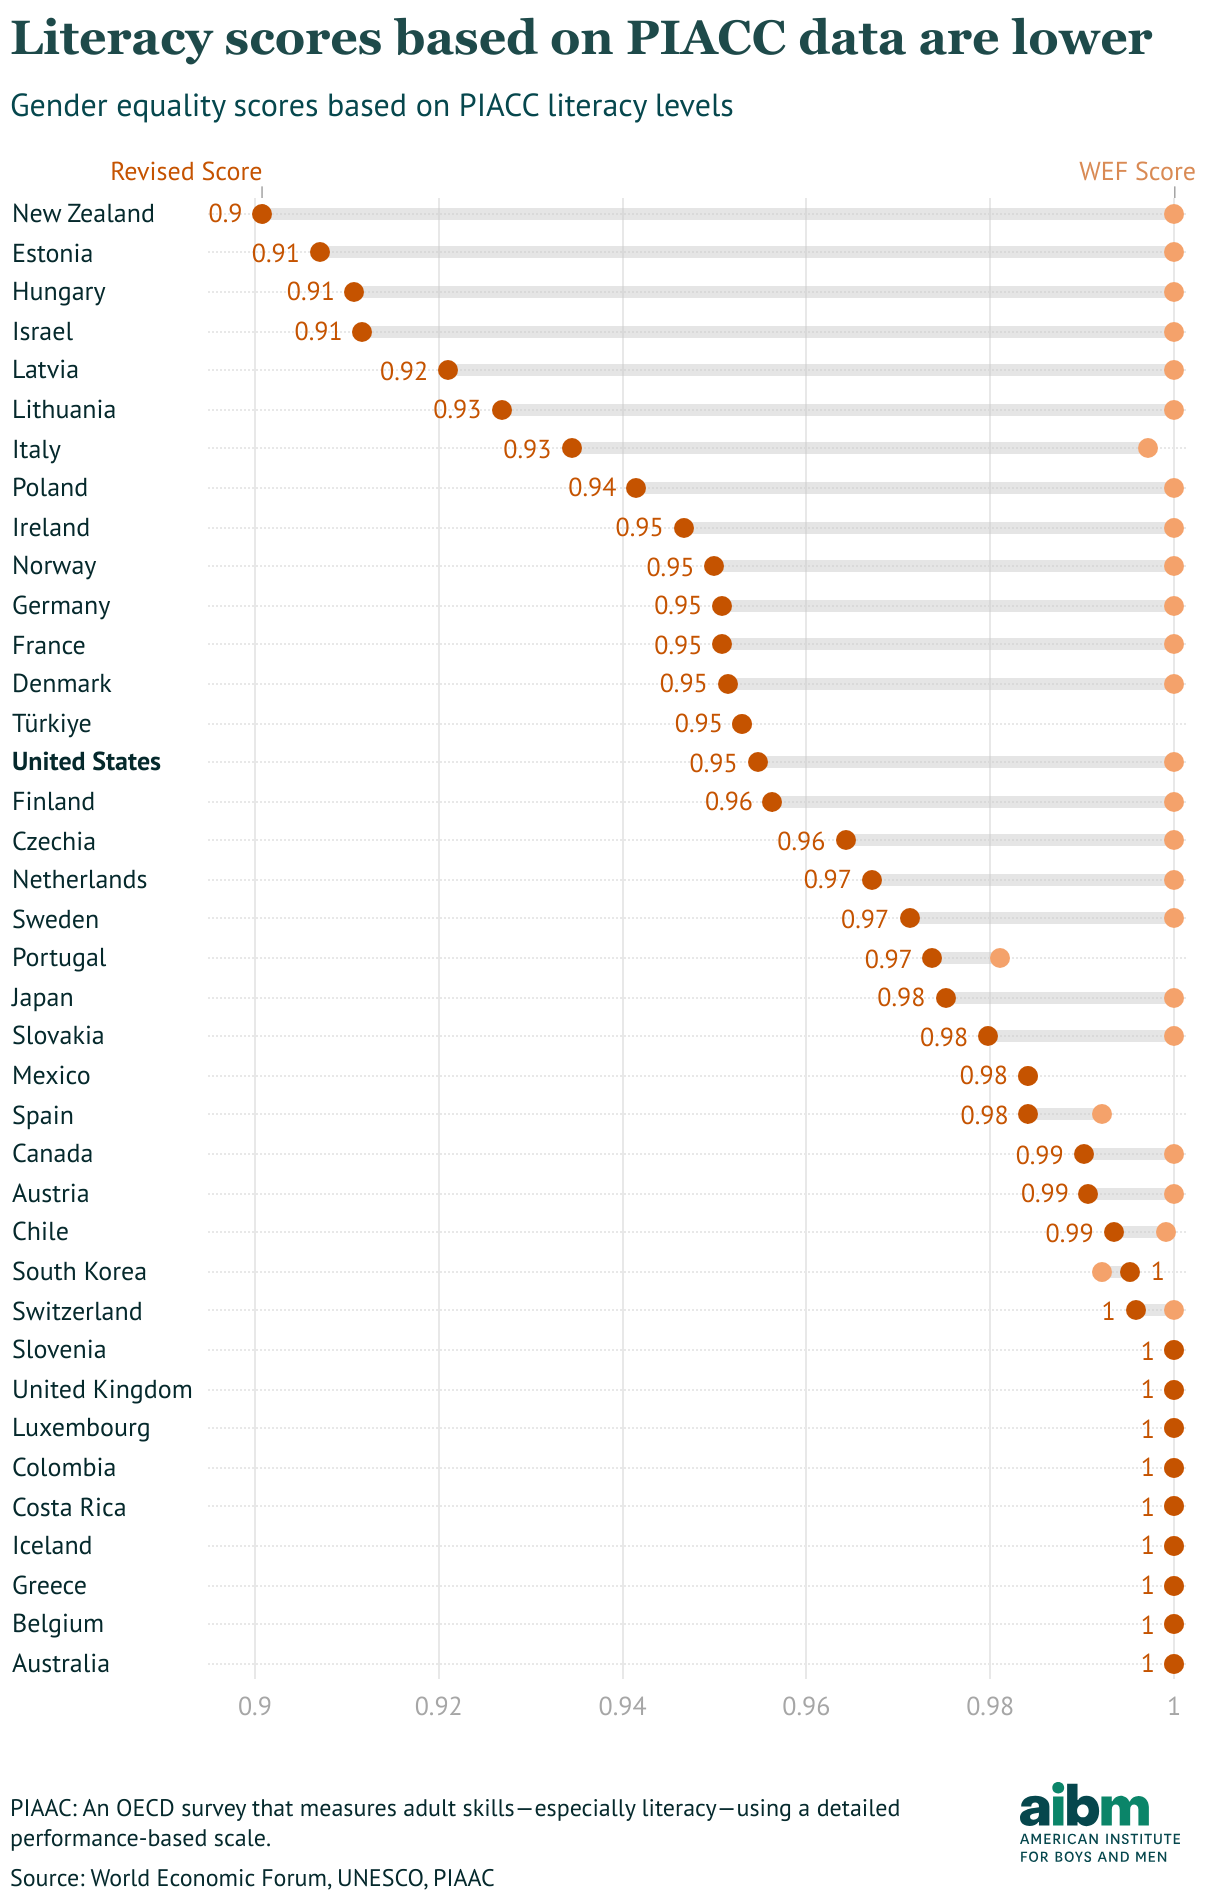
Figure 3
By this revised metric of literacy, most OECD countries have a gender gap in which men are at a disadvantage, though not as big as the ones for tertiary education.
Replicating the GGGR methodology, we calculate a weighted sum of the four indicators of Educational Attainment. The results are shown in Figure 4.
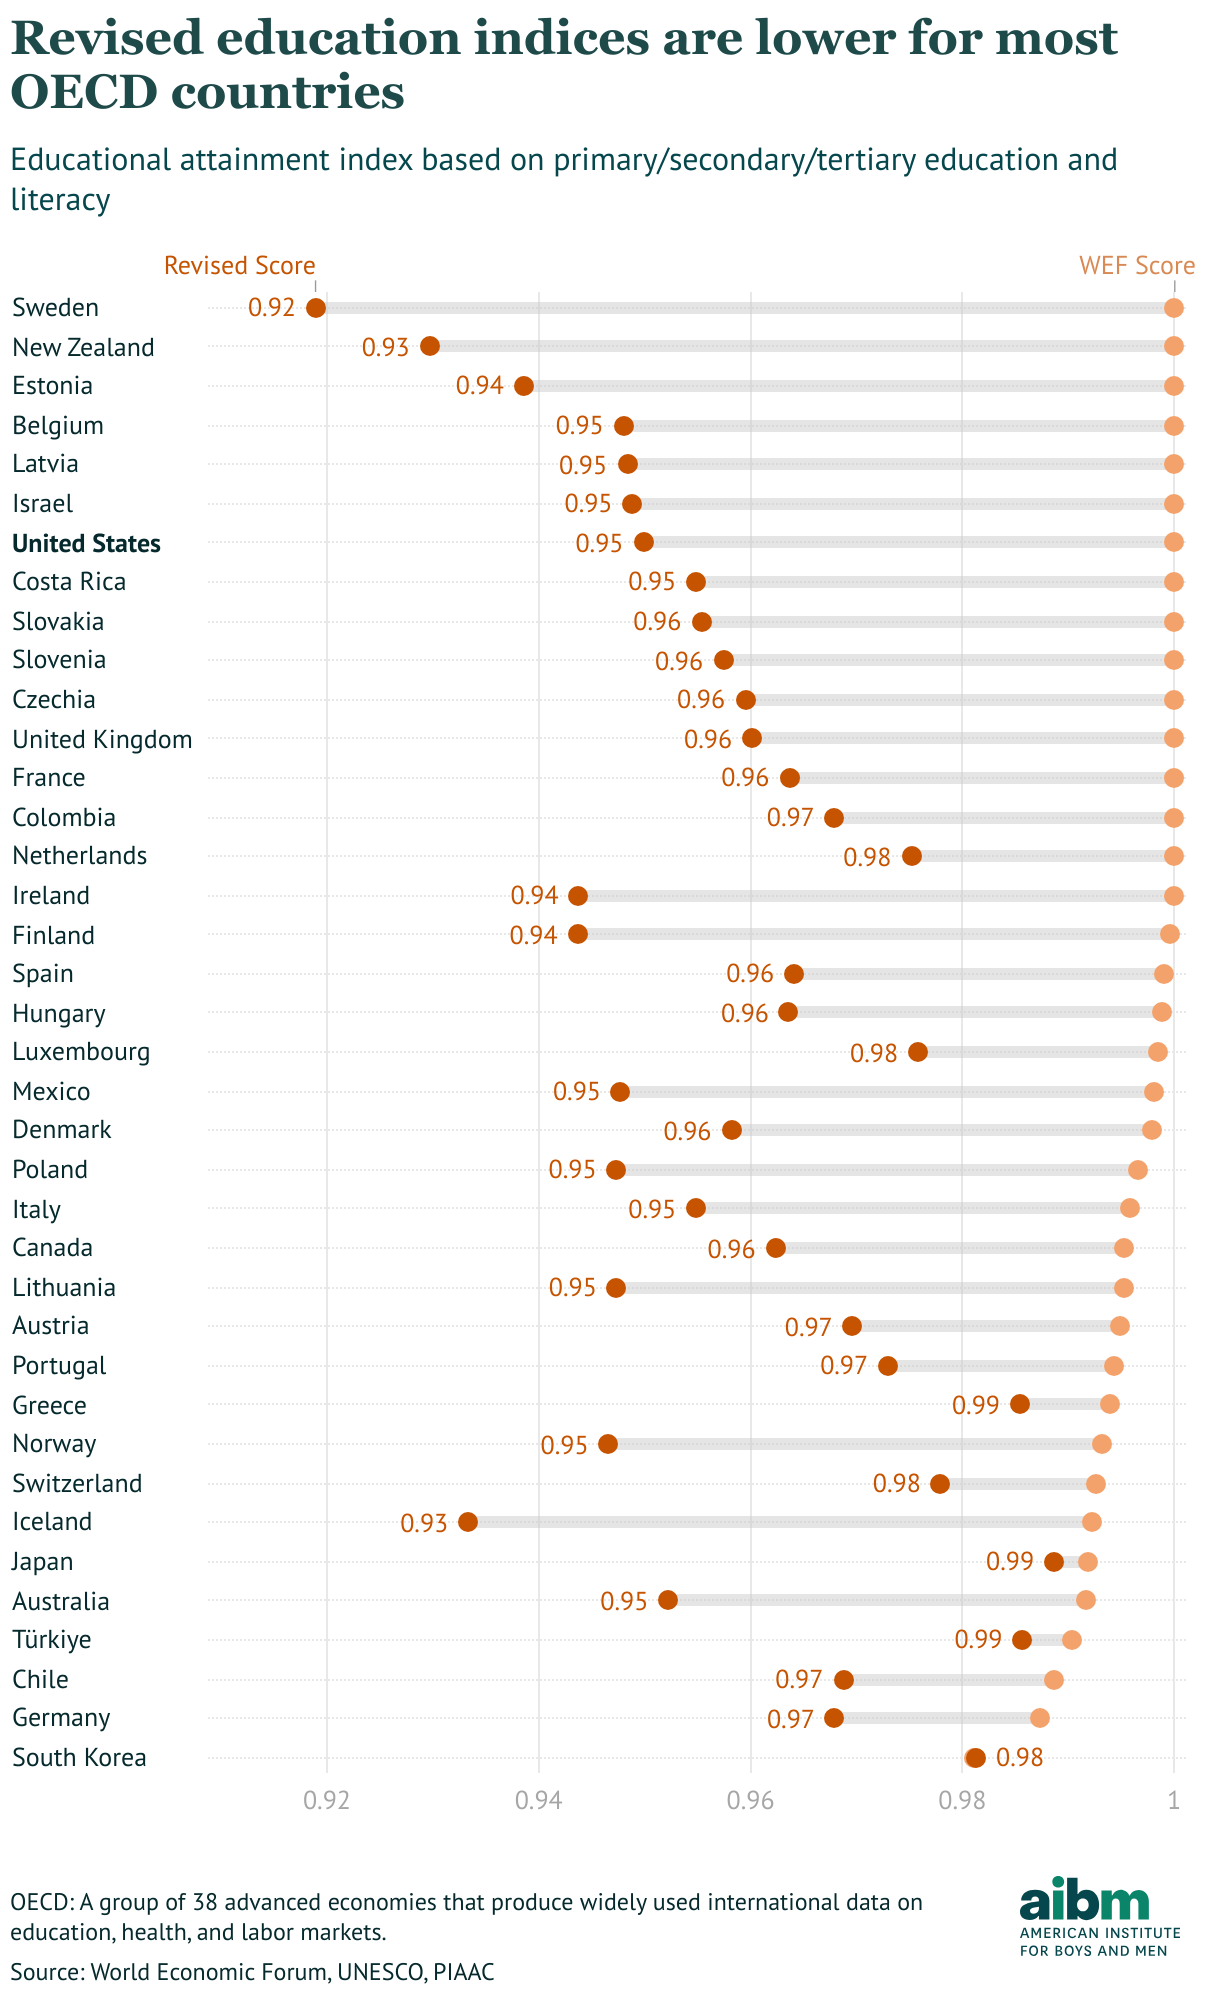
Figure 4
The revised scores are lower for every OECD country except South Korea. Many are substantially lower. The rankings also change dramatically, with Sweden dropping from tied for first to last, for example. Japan, which ranks as one of the most unequal nations in the OECD according to the GGGR, jumps to first place under our revised methodology, mostly because Japanese men are as likely to go to college as Japanese women.
Economic participation and opportunity
Indicators for this dimension in the GGGR are labor force participation; a survey measure of perceived wage equality; earned income; and the fraction of men and women in legislative and professional roles.
On most of these indicators in most OECD countries, women lag behind men. The exception is the ratio of women to men in professional and technical roles, shown in Figure 5.
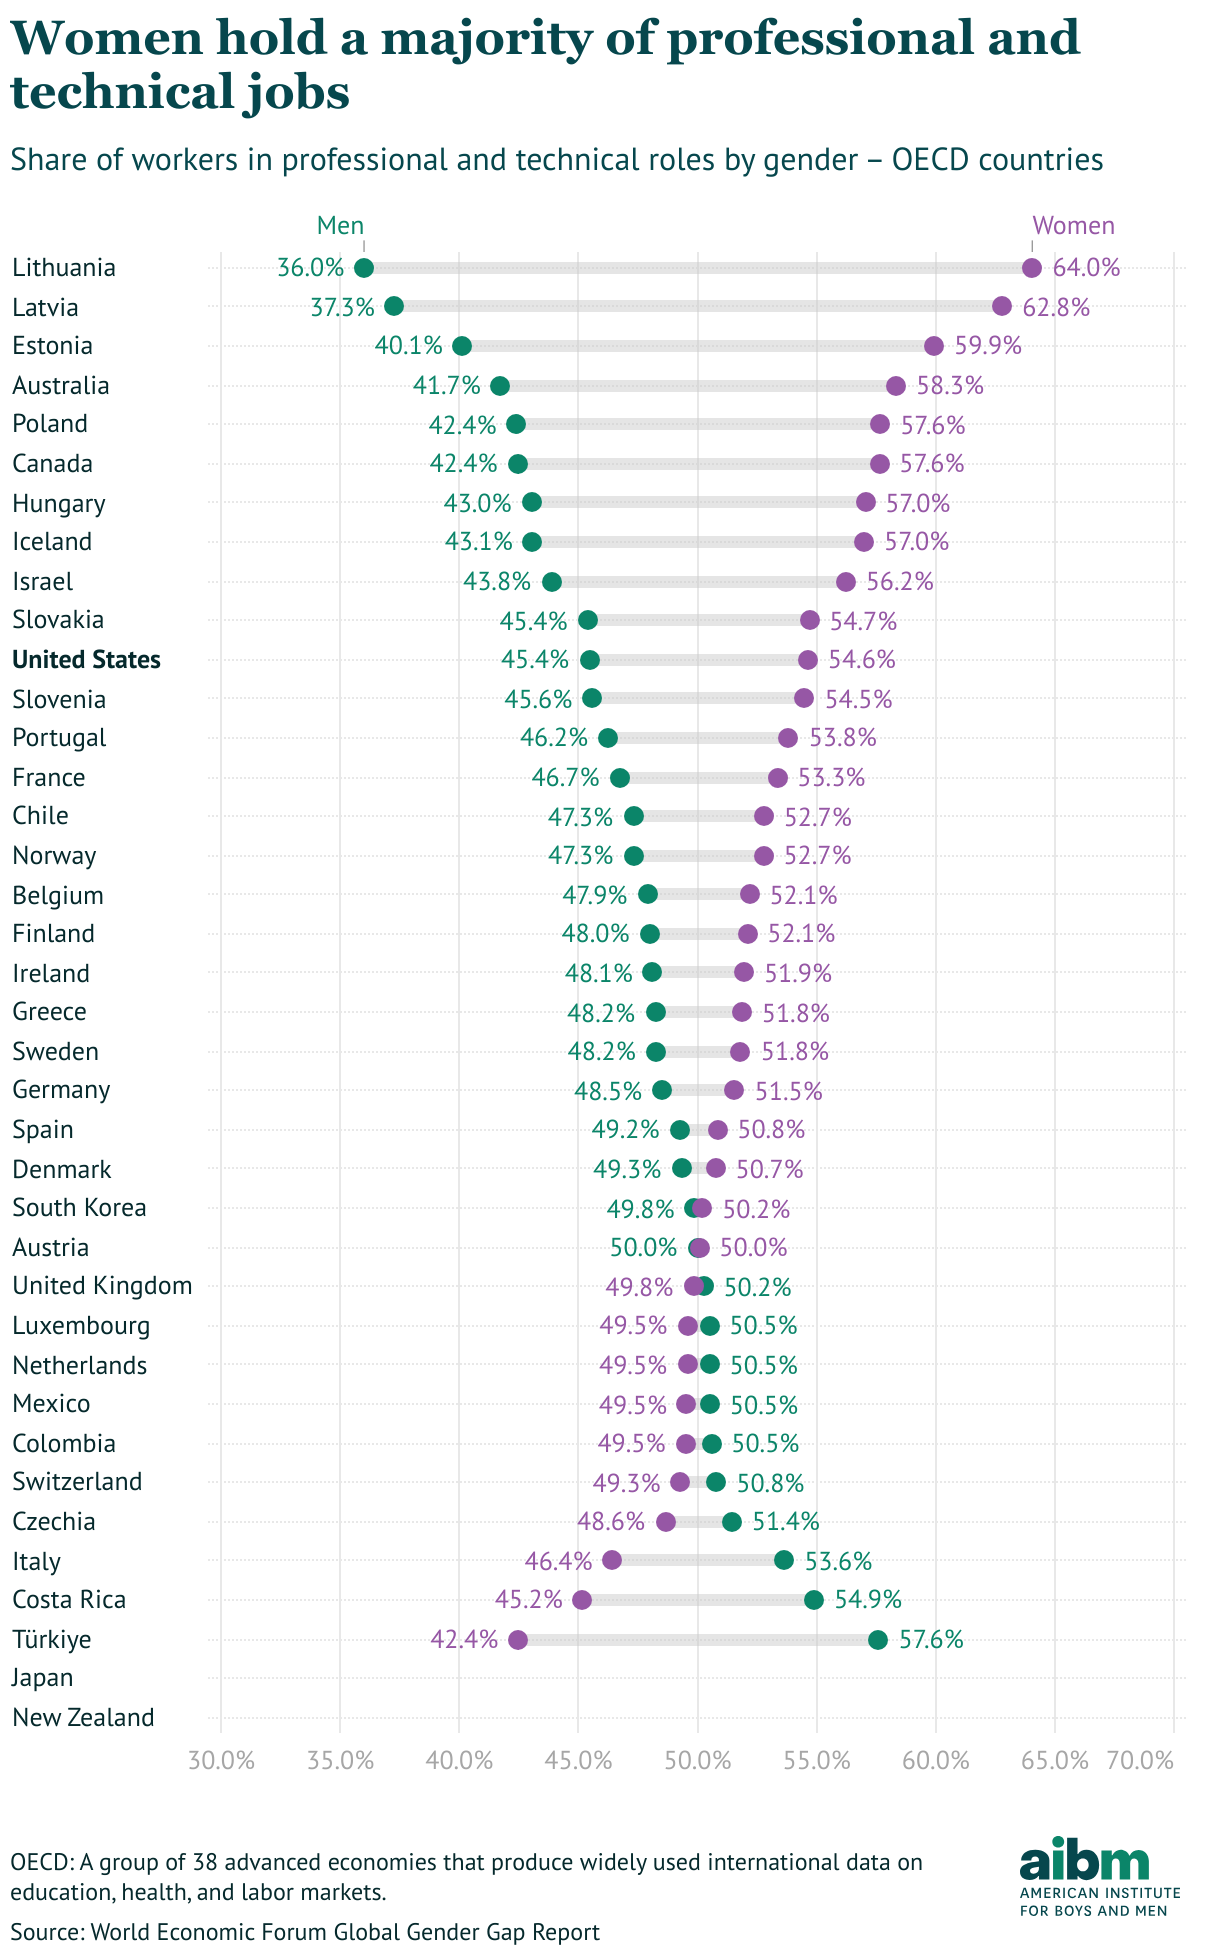
Figure 5
In most OECD countries, there are more women than men in these roles, a gap that is not captured in the GGGR because of truncation. As a result, some of our revised scores for this indicator are substantially lower, as shown in Figure 6
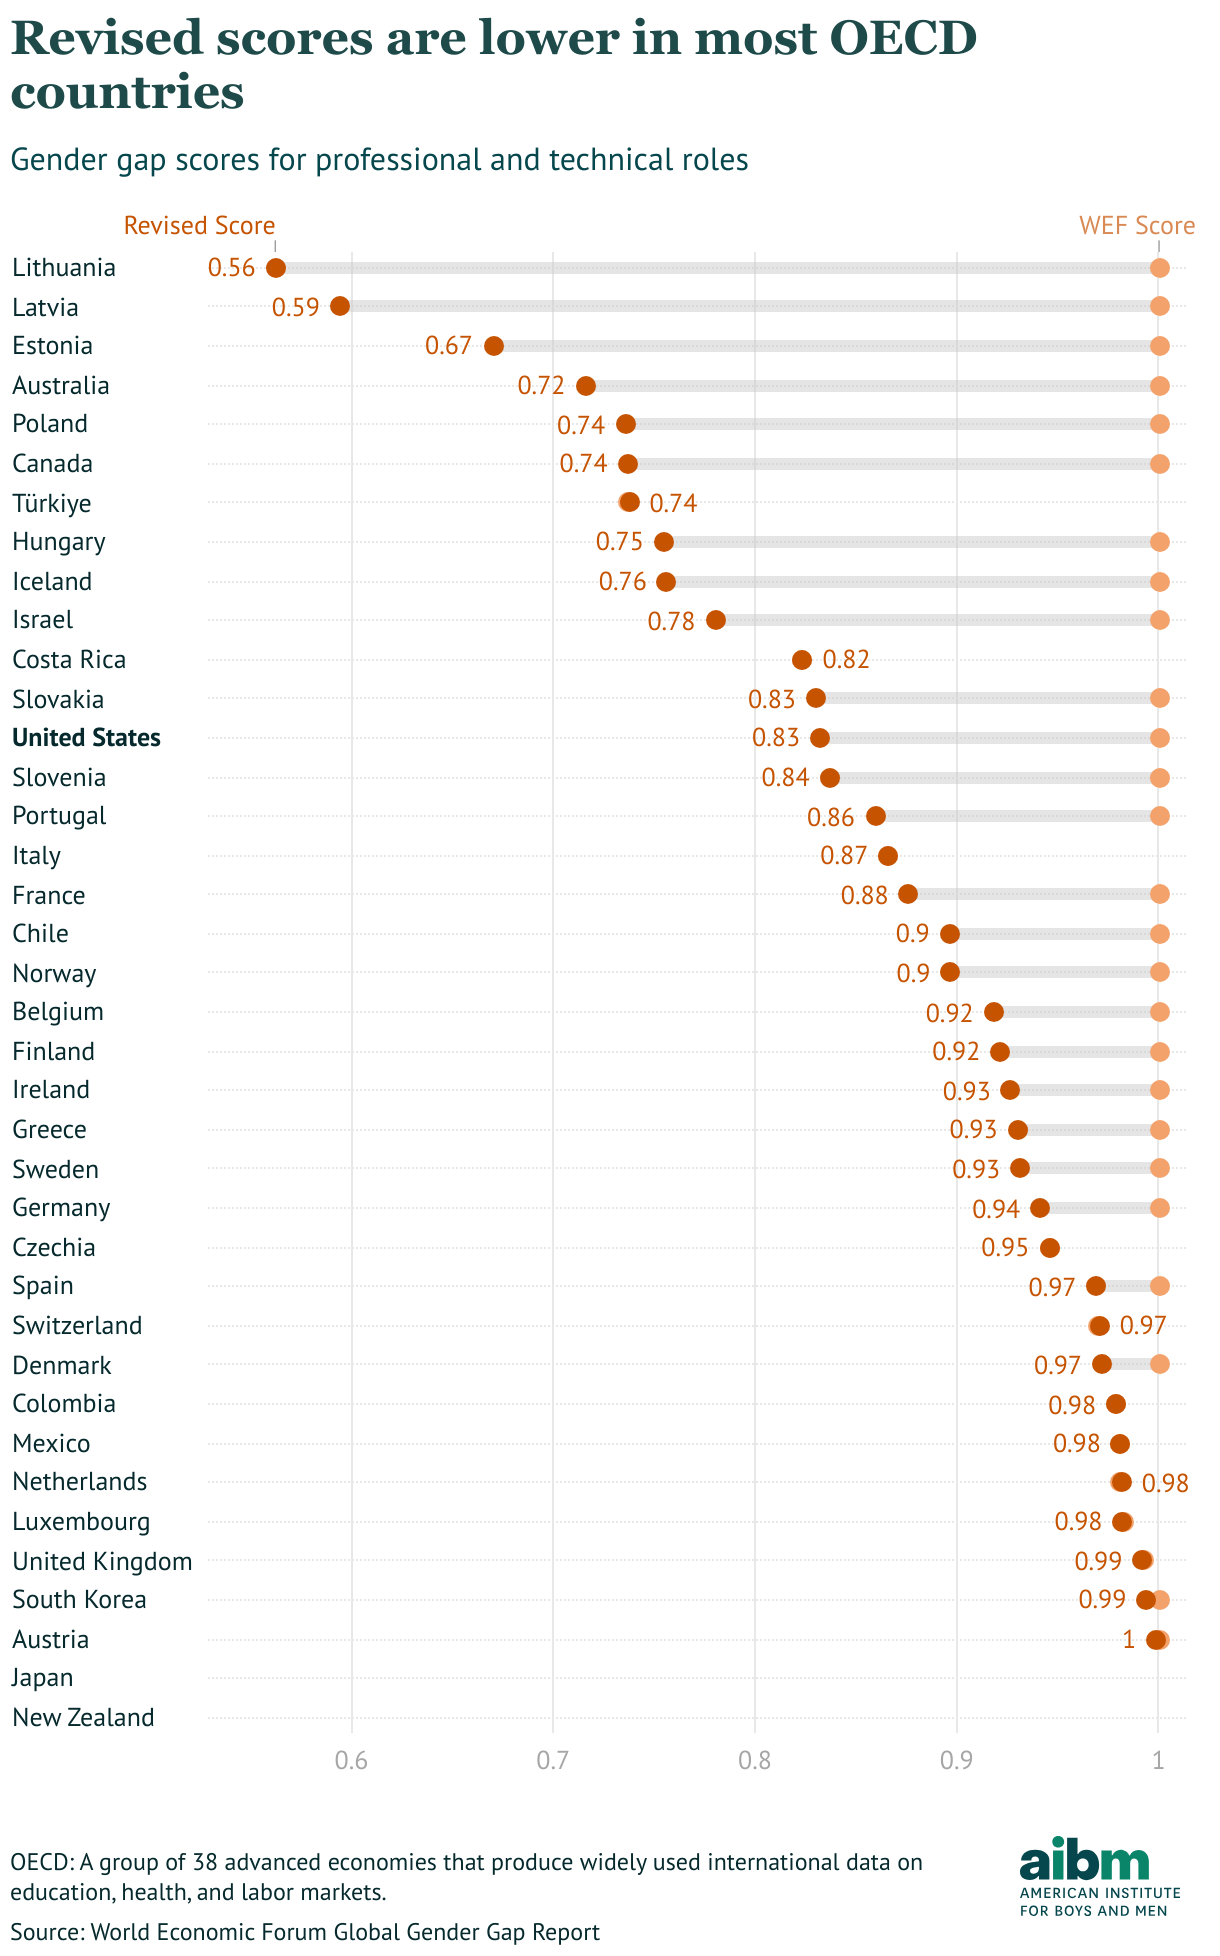
Figure 6
The biggest shifts are in the Baltic states, where women outnumber men in professional roles by almost two to one.
In contrast, there are more men than women in senior roles in all OECD countries — as a result, the revised scores are identical.
According to the WEF report, the indicator for estimated female earned income is computed using “female and male shares of the economically active population, the ratio of the female to male wages, gross domestic product […], and female and male shares of population.” Since this indicator is not based on a truncated ratio, the revised scores are identical.
Finally, wage equality for similar work is based on survey responses from business leaders who were asked, “In your country, for similar work, to what extent are wages for women equal to those of men?” This indicator, drawn from WEF’s Executive Opinion Survey, is based on a 1-7 scale, which is averaged and then converted to a 0-1 scale. Since this indicator is not based on a truncated ratio, our revised scores are identical.
It is plausible that this survey question elicits social desirability bias in both directions: some respondents might downplay wage inequality to reflect their countries in a positive light; others might overstate it as a form of advocacy. Either way, it is based on opinions, not data. Additionally, the sample sizes are small. While WEF does not publish the full details of the response rates or sample sizes, in 2023 the survey captured 11,240 valid responses from 113 economies, so the average sample size per country was about 100. In Austria in 2022, as one example, the response rate was 11%, yielding a total of 113 responses.
Given these concerns we considered dropping this indicator, which has a sizable weight in the GGGR index. We elected to retain it to minimize the differences between the WEF methodology and ours. As others have noted, however, it is a weak spot in the GGGR methodology which they might consider dropping, especially as the index already contains a quantitative measure of actual wage gaps.
Combining the revised economic indicators into an overall score, the result is lower for many OECD countries, but not all, as Figure 7 shows.
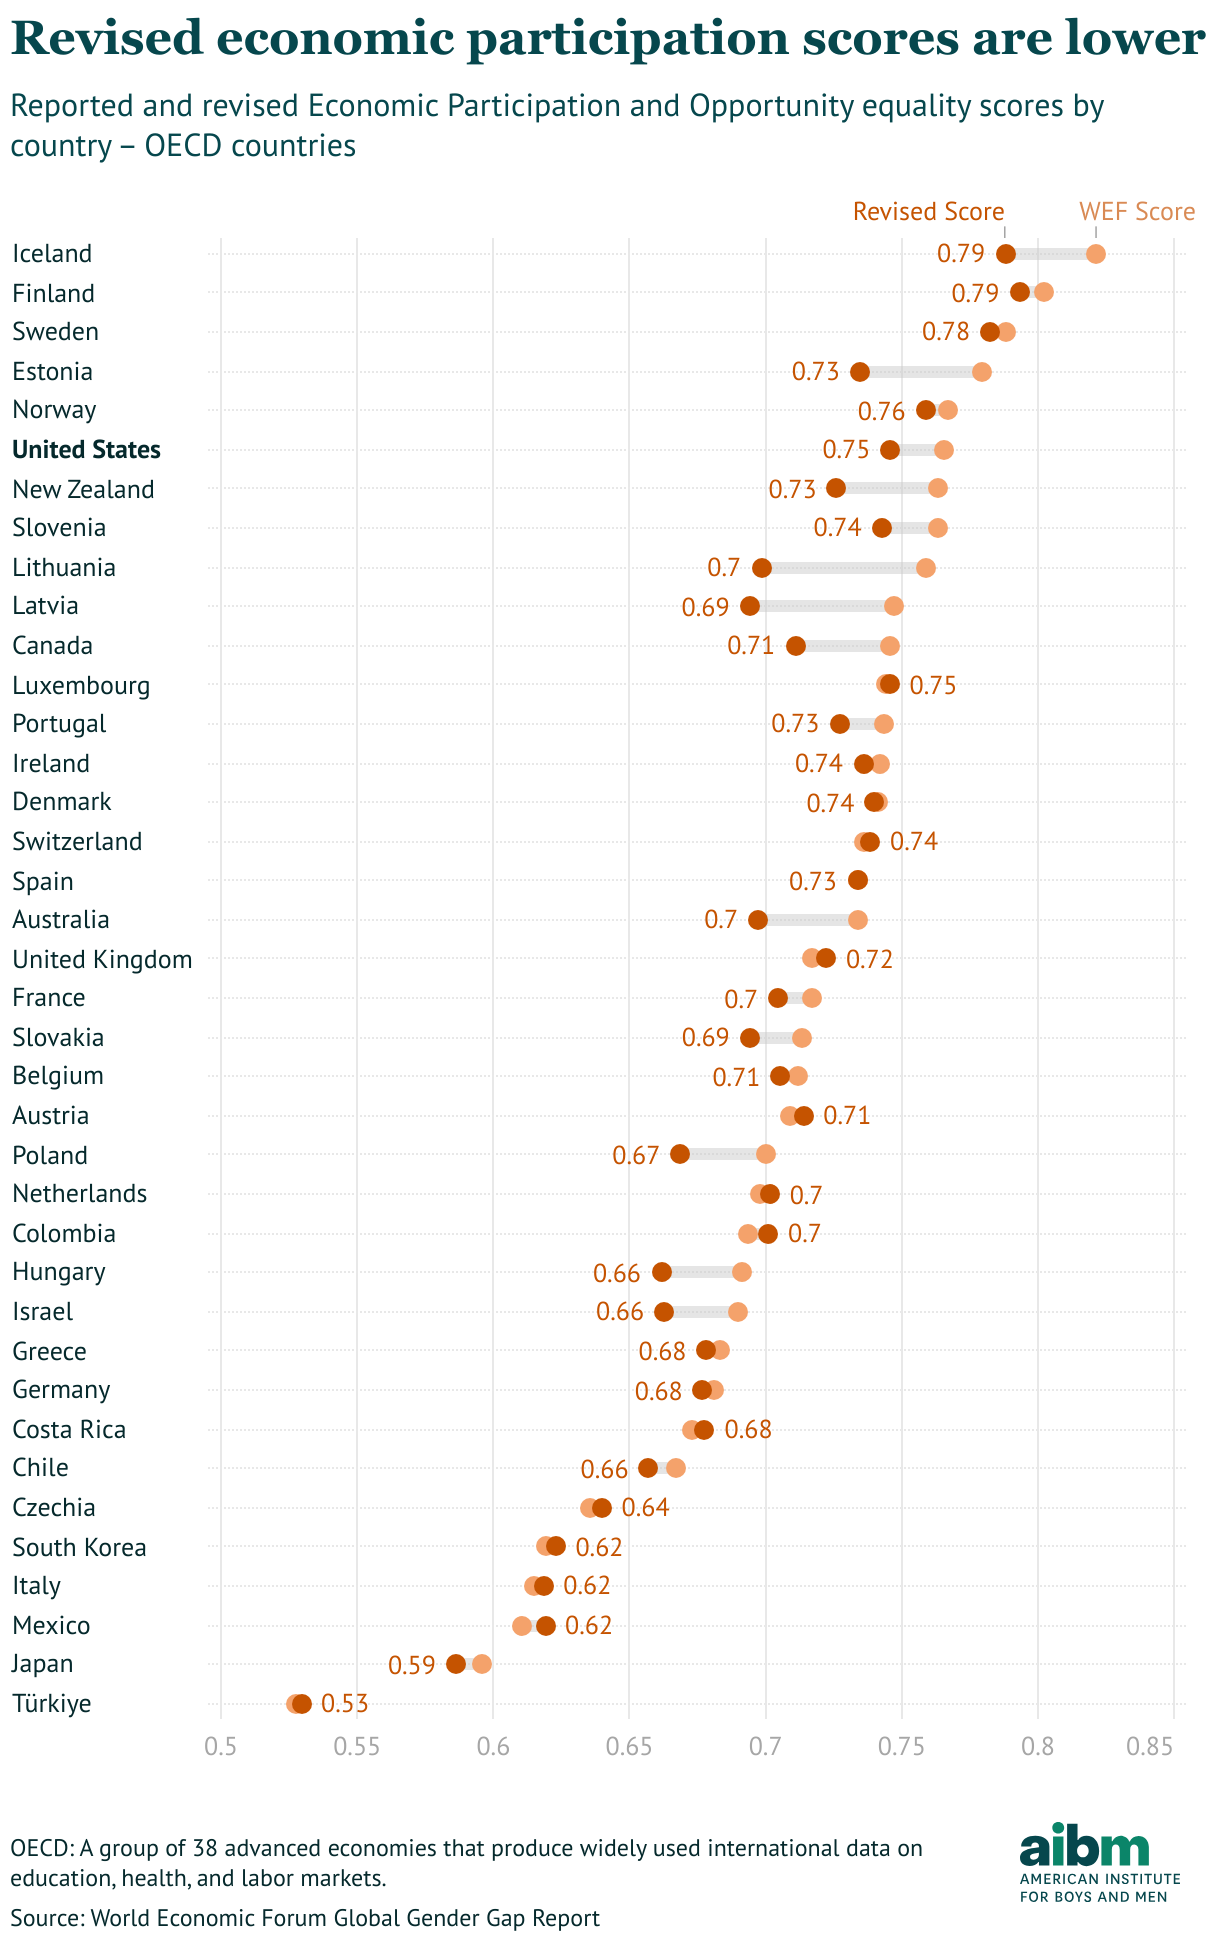
Figure 7
With the revised indicators, some countries move up in the rankings and others down. The biggest losers are the Baltic states. Although the revised indicators for the United States are lower, its rank improves from 22nd to 17th — because economic indicators for several other countries decreased by more.
Health and survival
There are only two indicators in this dimension: healthy life expectancy and sex ratio at birth.
As discussed above, the GGGR treats a gap of 4-5 years of healthy life expectancy between men and women as equality. Given the variation between countries, however, it is clear that this gap is not inevitable. It also seems somewhat perverse, in a gender gap report, to punish countries with smaller gender gaps.
In our revised approach, a country with a ratio close to 1 is considered to have achieved gender equality. A lower ratio is taken as evidence that women’s health is poorer than it could be; a higher ratio is taken as evidence that men’s health is poorer than it could be. On this scale, 1.0 is the highest possible score, but we add 0.06 to all scores so the new scale is comparable to the original, with 1.06 as the highest score. The following table shows this calculation for three selected countries.
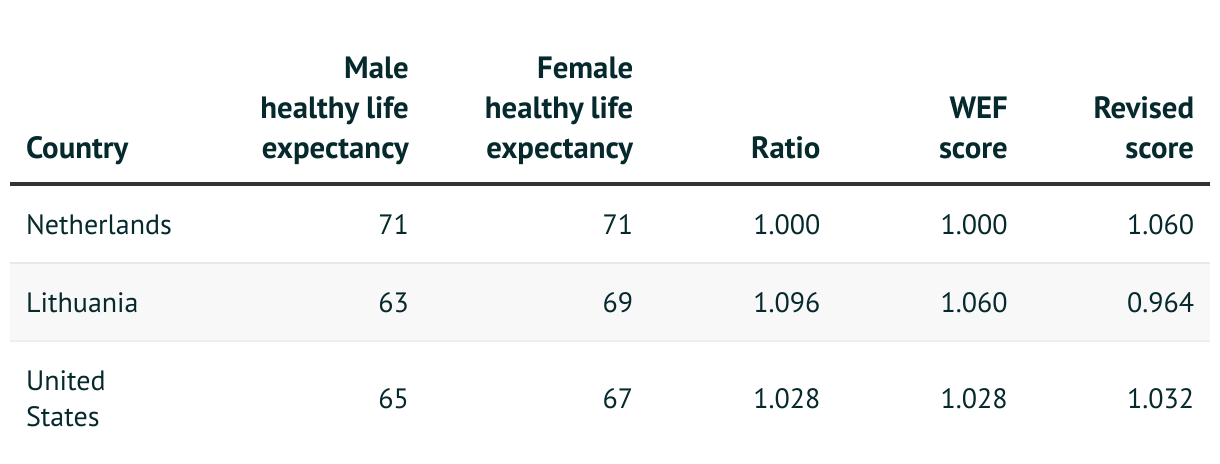
Table 1
In the Netherlands, healthy life expectancy is almost the same for men and women. The ratio is 1.00, so the WEF score is 1.00, which is the lowest in the OECD. In the revised approach, the Netherlands is at parity, so the deduction is 0 and the revised score is 1.06 — the top of the scale.
In Lithuania, the ratio is 1.096. That exceeds the target, 1.06, so WEF assigns the truncated score 1.06 — the top of the scale. In the revised approach, Lithuania exceeds parity by 0.096, so the revised score is 1.06 – 0.096 = 0.94 — the worst in the OECD.
Finally, in the United States, the ratio is 1.028, and the WEF score is the same. In the revised approach, the United States exceeds parity by 0.028, so the revised score is 1.06 – 0.028 = 1.032.
Among OECD countries, this revised indicator completely flips the script, as Figure 8 shows.
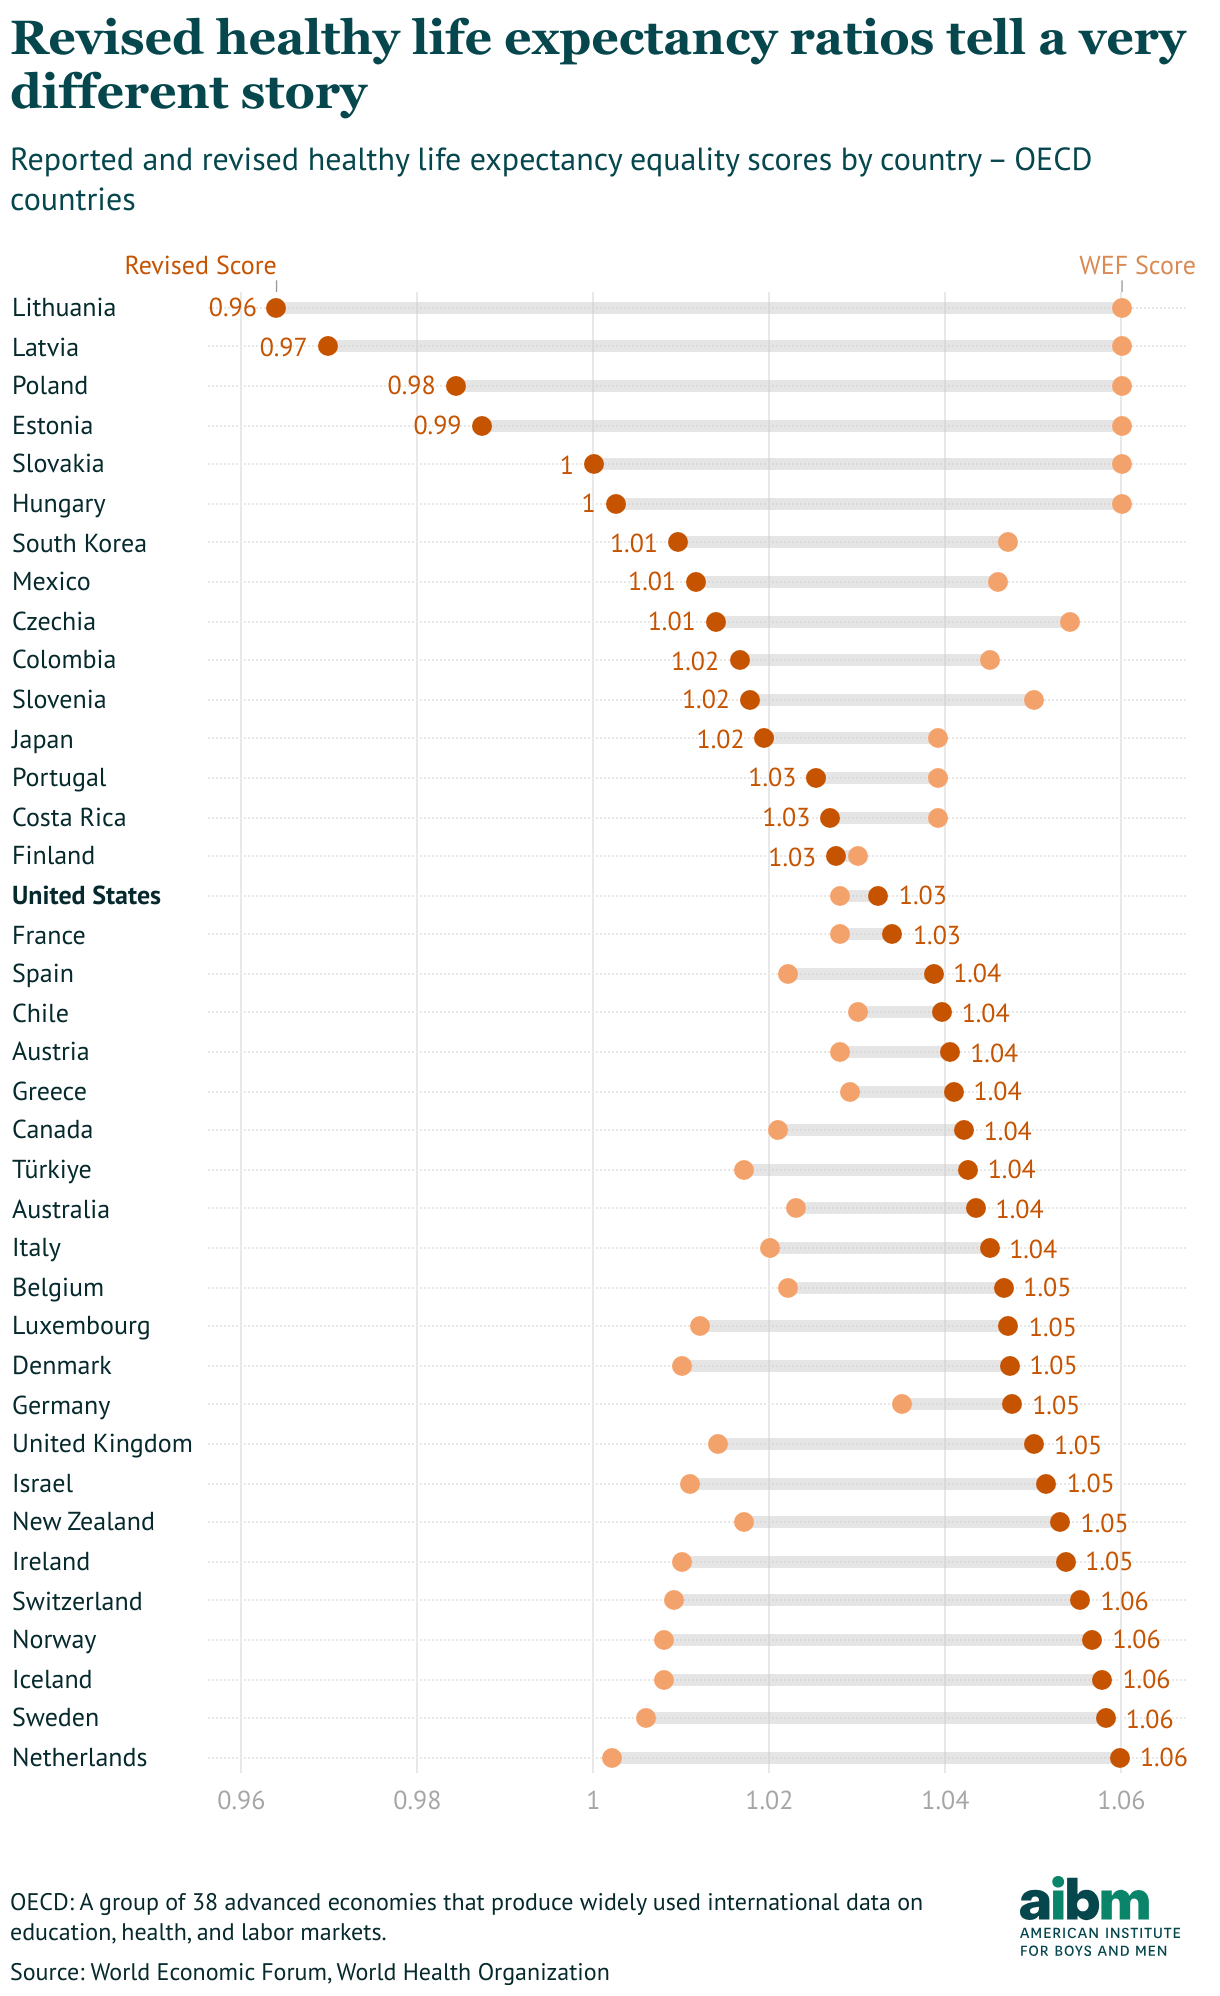
Figure 8
Many countries that get a “perfect” 1.06 using the GGGR methodology score substantially lower with our revised benchmark. Several Northern European countries get a revised score near the maximum. The United States is near the middle of the pack by either measure.
The second health indicator, sex ratio at birth, is usually expressed as the ratio of male to female births. In most countries it is close to 1.06, which means 106 boys for every 100 girls. A lower ratio can be the result of gender-biased reproductive practices that indicate preference for sons and lower valuation of daughters.
To convert this ratio to an indicator in the range from 0 to 1, the GGGR inverts it, so the nominal ratio 1.06 is transformed to a score of 0.944. And that is the score assigned to almost all OECD countries. As a result, there is almost no variability in this indicator within the OECD, and what variability there is may not indicate gender bias. Nevertheless, this variable accounts for 69% of the Health and Survival subindex. As a result, the real differences in healthy life expectancy are diluted.
The following figure shows the revised index of health and survival.
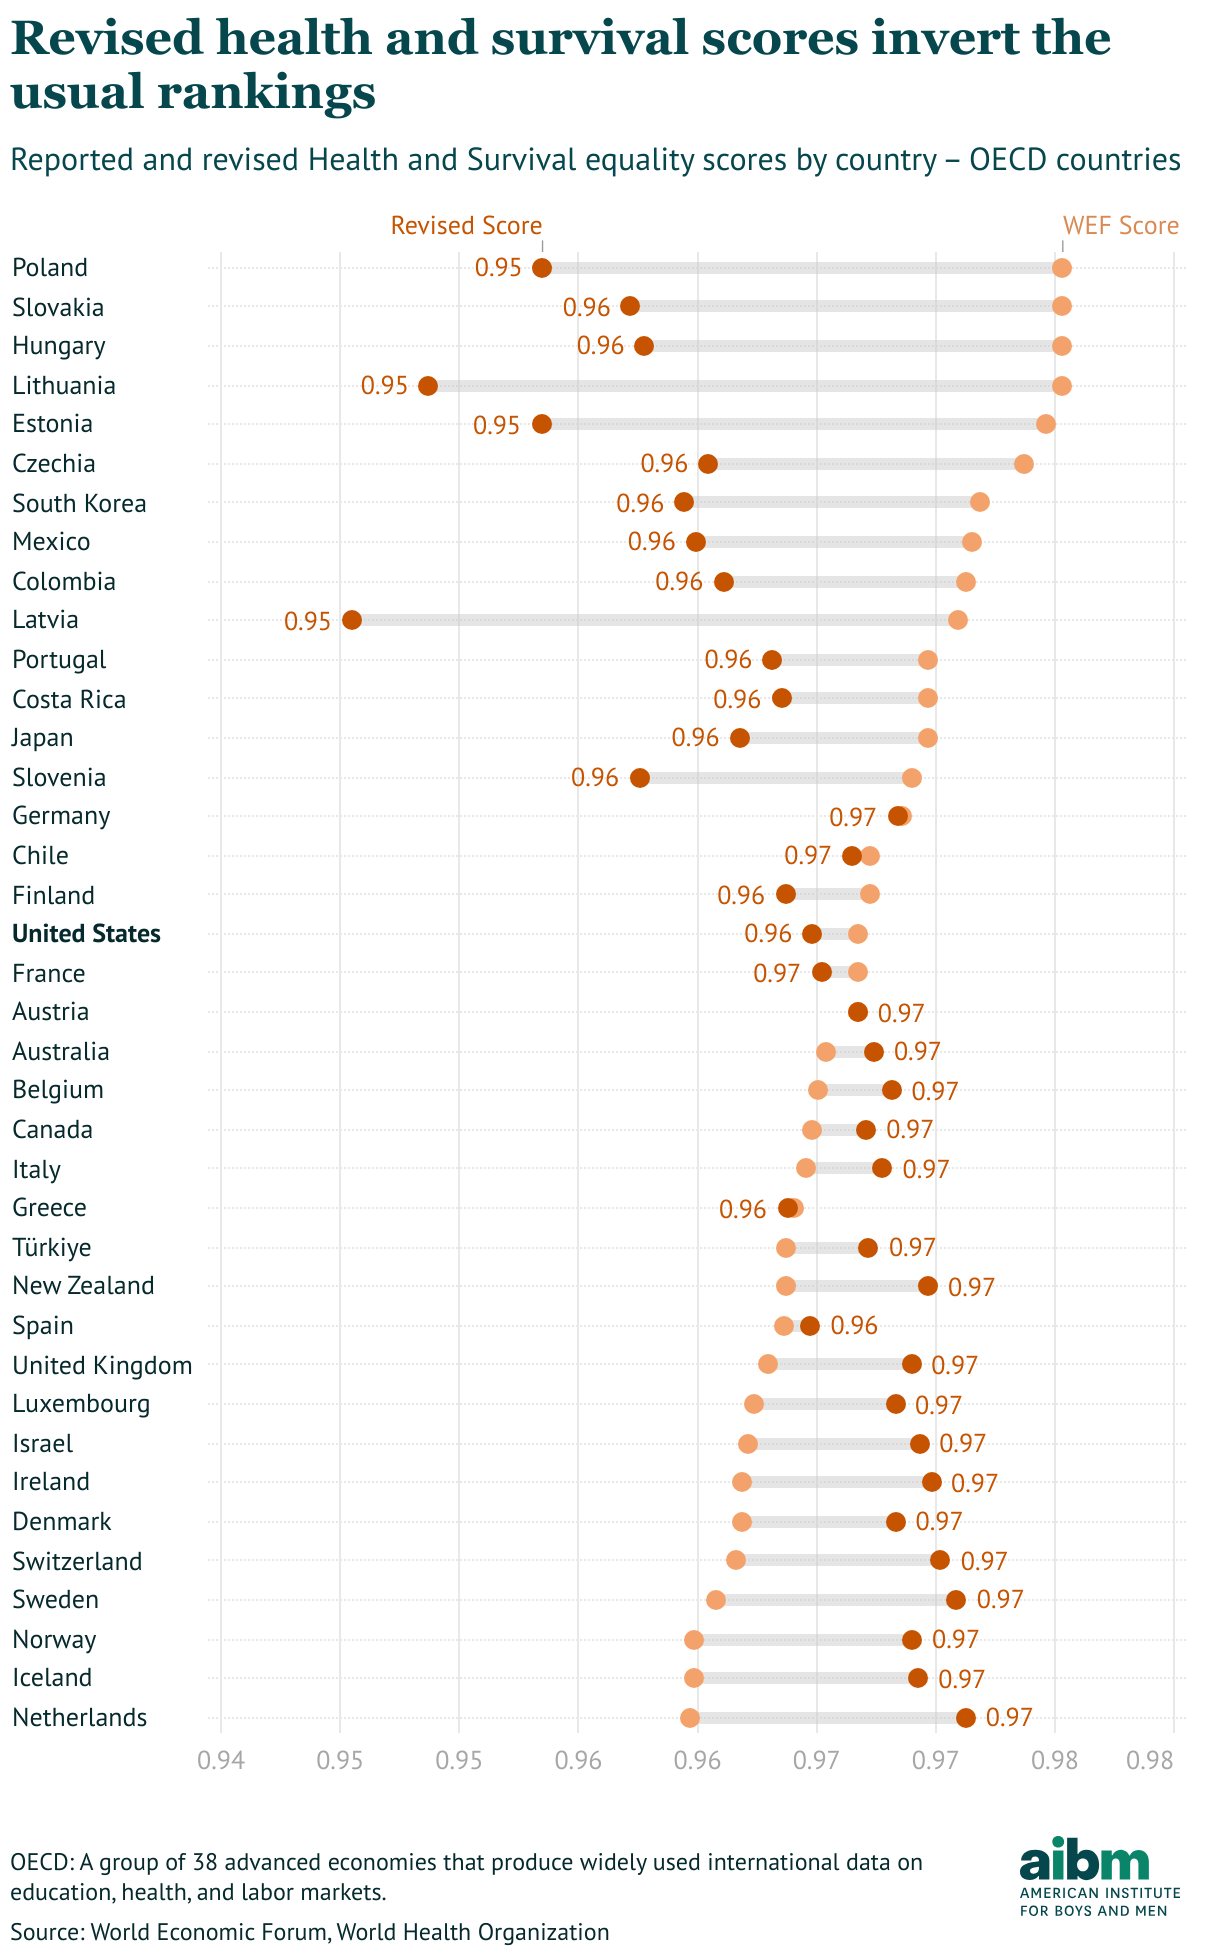
Figure 9
We also computed revised ranks. Hungary, Slovakia, Lithuania, and Poland, which were tied for first under the GGGR methodology, end up with ranks in the 100s. And the Netherlands, which ranks 126th by GGGR benchmarks, moves up to 2nd place — which probably reflects more accurately the gender equality of health care and outcomes. The United States, which ranks 77th by GGGR benchmarks, moves up to 55th, just ahead of Spain and behind Qatar.
Political empowerment
Indicators of women’s political empowerment include the fraction of women in parliament (or a comparable political body), the fraction of women in ministerial positions, and the fraction of years with a female head of state, out of the last 50.
There are no OECD countries with substantially more women in parliament than men, so truncation has almost no effect on this indicator.
Similarly, there are only a few countries with more women than men in ministerial positions, so most of the revised scores are identical. The exceptions are the Netherlands, Norway, Belgium, Finland, and Portugal.
Finally, there is only one OECD country with a female head of state for more than half of the last 50 years (Iceland); the revised scores are identical for the others.
As a result, the revised political empowerment index is the same for most OECD countries, and the rankings are almost unchanged.
The revision has only a small effect on the score for the United States, and only a small change in rank, from 63rd to 65th — just behind India and ahead of Italy.
Overall Gender Gap Index
Our revisions have a big effect on some indicators, especially tertiary education and healthy life expectancy, and little or no effect on others. When we combine the indicators into a single Gender Gap Index, as shown in Figure 9, the larger effects on some indicators are diluted.
Nevertheless, the net effect is that most OECD countries end up with lower scores, some by a wide margin.
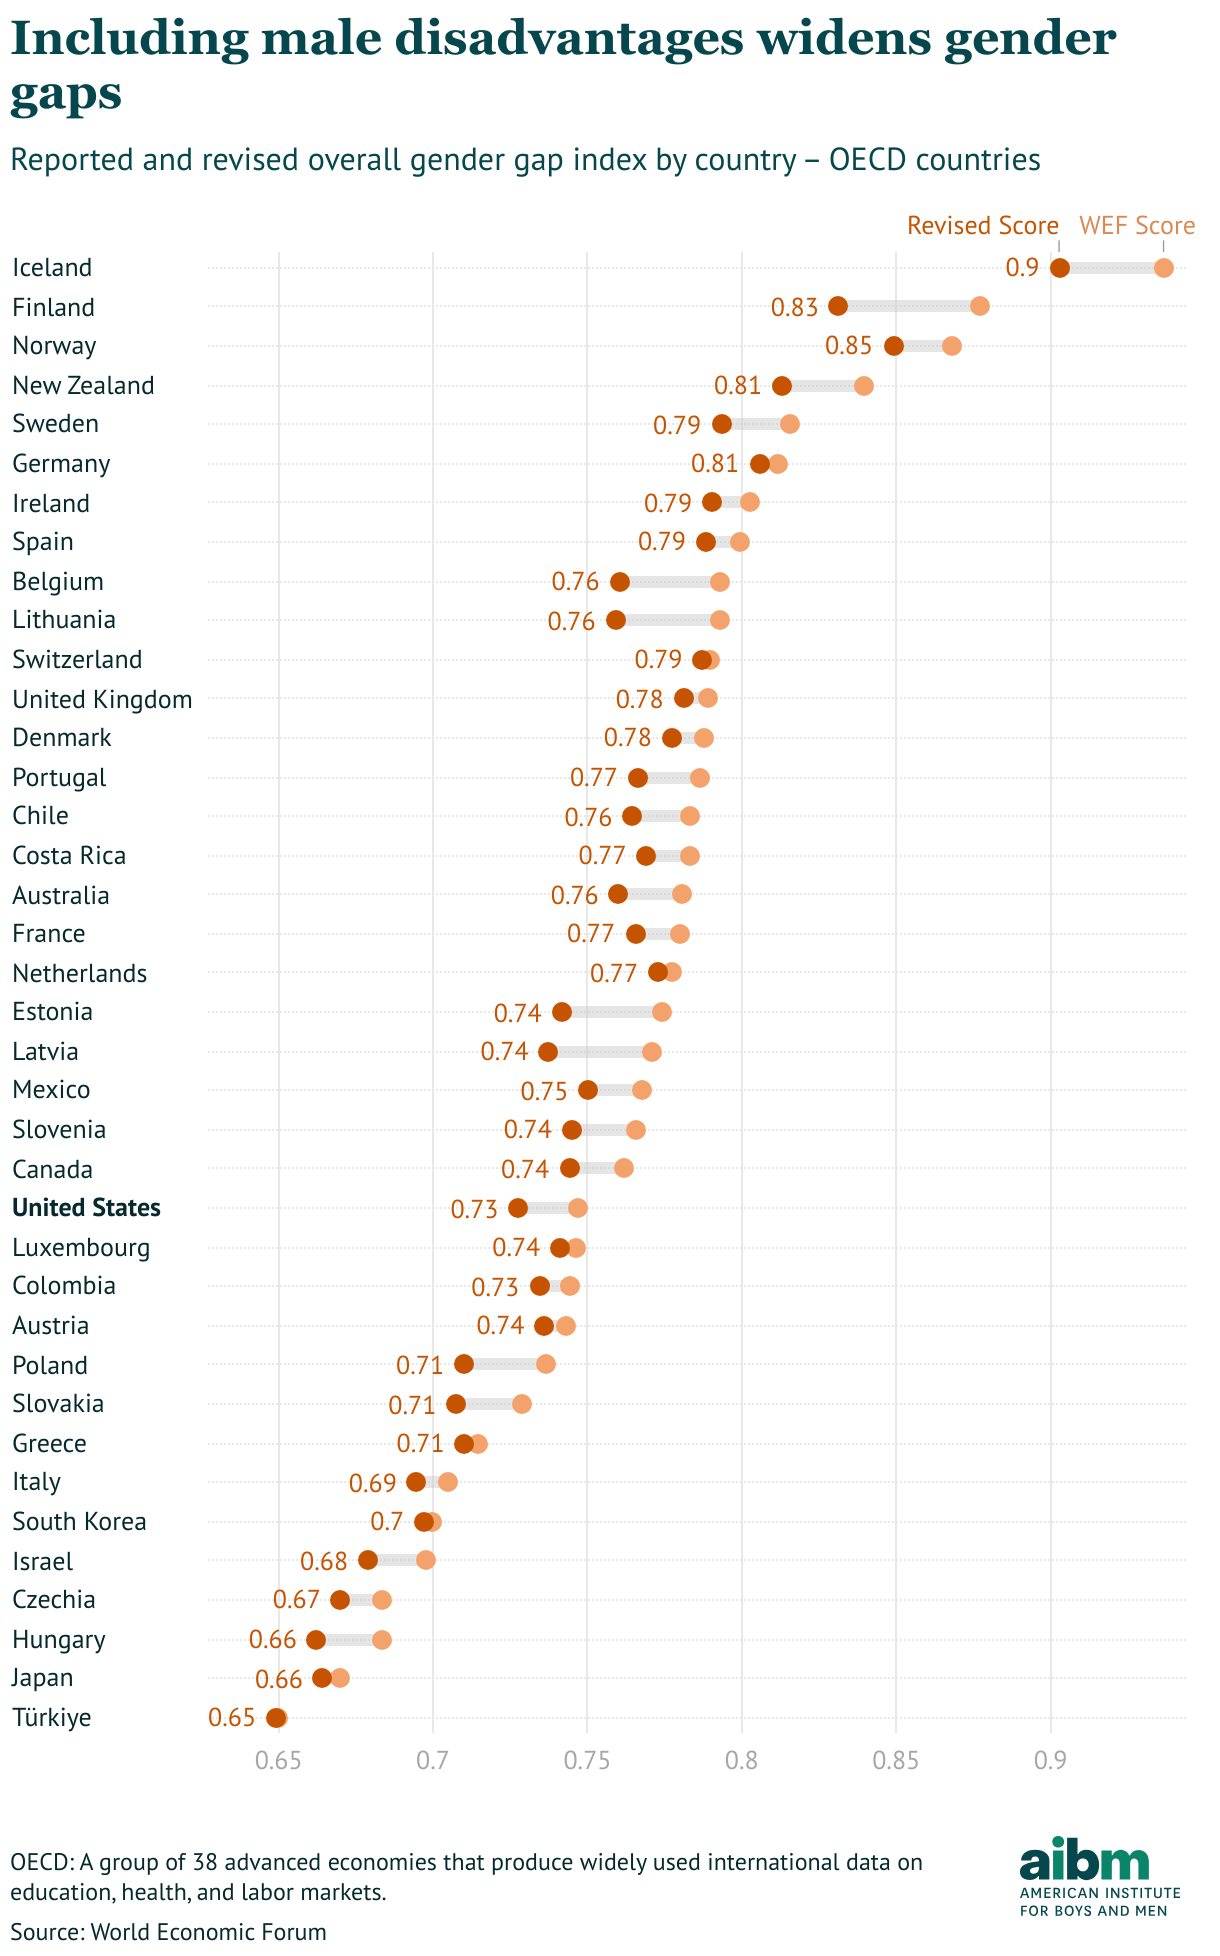
Figure 10
The effect of the revisions on the rankings is mixed. Most of the countries that rank high under the WEF methodology also rank high with the revised indicators.
Belgium and Lithuania drop several places, and the Netherlands improves substantially — primarily because it is no longer punished for achieving equal health outcomes for men and women. The United States moves down the rankings slightly , from 43rd to 47th.
Measuring gender gaps better
As we noted in the introduction, there is a case for reports focused on gender gaps as they impact women and girls, and for ones concerned with boys and men. However, it is important to be clear about the purpose. If a report is about women’s empowerment, it would be more effective to make that clear than to label it as a “gender gap” report, which might give the impression that it takes account of gender gaps in both directions.
There is also a case for gender gap reports and indices that provide a more comprehensive overview of areas where men are behind women, as well as those where women are behind men. This would help policymakers who are concerned to address gender inequalities in both directions. We have made a partial attempt at such an approach here by revising the GGGR methodology, but there is scope for a much more robust approach.
“There is now wide consensus that gender inequalities are unfair, and lead to wasted human potential,” writes Francisco Ferreira, writing as Director for Development Policy in the World Bank’s Development Research Group and now Amartya Sen Chair in Inequality Studies at the London School of Economics, commenting on education gaps. “That remains true when the disadvantaged are boys, as well as girls.”
Subscribe to our newsletter
Get the latest developments on the trends and issues facing boys and men.
¹ Part III, Measure 34: Mannsutvalget, Likestillingens neste steg: NOU 2024: 8, (Oslo: Kultur‑ og likestillingsdepartementet, 2024), 239.