ResearchHealth
Is it inevitable that men die younger than women? Looking at evidence and policy solutions

Summary
In most countries, women live longer than men. But the life expectancy gap is not inevitable, and across the United States and other developed countries, its magnitude varies widely and has changed substantially over time. This suggests that social conditions, public health systems, economic circumstances, and policy have an important role in shaping the rates of excess mortality among men.
I analyzed life expectancy and cause-specific mortality data across the United States and other OECD countries from 2000 to 2023 to understand how much the gap varies, which causes of death contribute most to it, and where policy might be most effective. The evidence points to six main findings:
- The gap is large and variable. Between 2000 and 2023, the largest gap in life expectancy between men and women across OECD countries was 12.7 years (Lithuania, 2007) and the smallest was 2.5 years (Israel, 2015). The United States was in the middle, at 5 years.
- The gap has been shrinking. Over that interval the OECD average fell from 6.5 to 5.1 years. Overall, the life expectancy gap narrowed in 35 of 38 OECD countries, and in 8 of them by more than two years.
- A few causes drive most of the U.S. gap. The United States is close to the OECD average at 5.0 years (as of 2023). The largest contributors are road traffic (0.8 years), drug use disorders (0.8 years), and suicide (0.5 years). Together with homicide (0.3), liver disease (0.2), cancer (0.2), and alcohol (0.2), these causes account for about 62%, or 3.1 years, of the 5 year gap.
- These gaps are smaller in other countries. If the United States could close the gender gaps in cause-specific death rates to the lowest levels seen in other OECD countries, the life expectancy gap would shrink from 5.0 years to about 2.9 years.
- The gap in healthy life-expectancy (HALE) is smaller but driven by similar causes. The gender gap in expected years of good health is smaller than the overall life-expectancy gap. In 2023, the United States HALE gap was 2.0 years, driven mostly by road traffic (0.9 years), drug use (0.5 years), and suicide (0.5 years). In most countries, healthy life expectancy has increased for both men and women, but men’s gains have often been larger.
- The leading causes differ by region. Road traffic is especially important in Latin American OECD countries; suicide, cancer, and liver disease are more prominent across much of Europe; and drug deaths are significant in the United States and Canada. These regional differences reinforce the broader point: the gap is not produced by a single universal cause, but by causes that vary across social, economic, and policy environments.
The policy implication is straightforward: interventions that reduce deaths from causes where men face higher risks can both improve public health overall and narrow the life expectancy gap. Lithuania’s experience with road-safety illustrates this point. After its accession to the European Union and related improvements in infrastructure, vehicle safety, alcohol control, and speed enforcement, its road-traffic gender gap fell from the worst in the OECD to close to the OECD average, and the estimated contribution of road traffic to the life-expectancy gender gap fell from 1.72 years in 2000 to 0.48 years in 2023. These policy changes were not aimed at men in particular, but because men make up a larger share of traffic fatalities, the reduction was larger for men and the gap in life expectancy shrank.
For the United States, my analysis highlights three areas where reducing death rates would have the largest effect on the life expectancy gap: road traffic safety, substance-use prevention and harm reduction, and suicide prevention. Additional levers include violence prevention and reductions in smoking and alcohol use.
Key terms
A few terms recur throughout. I define them here so the rest of the report can stay in plain language.
- Life expectancy gender gap: the difference between women’s and men’s “period life expectancy” in a given year (women minus men). A positive gap means women live longer.
- Period life expectancy: a summary measure based on the death rates observed in a single year. It does not predict how long people born that year will actually live; it describes mortality conditions in that year.
- Healthy life expectancy (HALE): the expected number of years lived in good health.
- Cause-specific death-rate gap: the difference between men’s and women’s death rates from a particular cause, such as road traffic, suicide, or drug use disorders (deaths per 100,000 people).
- Contingent: dependent on social, economic, institutional, commercial, and policy conditions, rather than fixed or inevitable.
The gap varies across countries and over time
Looking at differences between countries and changes over time illuminates numerous examples in which life expectancy gaps depend on public health and safety policies, economic conditions, and demographics.
The following figure shows the gender gap in life expectancy for 38 OECD countries from 2000 to 2023, with selected countries labeled. The large differences between countries, and the consistent decline across almost all OECD countries, suggest that the gender gap in life expectancy is not inevitable.

Figure 1
As figure 1 shows, there are significant differences between countries. The largest gap in the dataset was 12.7 years (Lithuania, 2007), and the smallest was 2.5 years (Israel, 2015). Currently (2023), some of the largest gaps are in the Baltic countries and some of the smallest in Scandinavia. The contrast is striking: the ferry ride from Tallinn to Stockholm is just 240 miles, yet Estonia’s gap (8.1 years) is more than double Sweden’s (3.7 years). Lithuania and Latvia also have gaps exceeding 8 years, while Norway, the Netherlands, Luxembourg, and New Zealand have gaps of less than 3.5 years. The United States sits close to the OECD average at 5 years.
There are also large differences over time. The OECD average dropped from 6.5 to 5.1 years between 2000 and 2023, an average rate of 0.6 years per decade. The largest decrease was in Estonia (1.5 years per decade); Slovenia, Lithuania, Colombia, and Hungary also closed faster than 1.0 years per decade. The only increases were in Mexico (0.8 years per decade) and Costa Rica (0.3 years per decade).
In the United States, the gap closed slightly between 2000 and 2015, then widened as more men than women began to die, largely due to the opioid epidemic (explored in detail later) and the COVID-19 pandemic. Since 2021, it has narrowed again as deaths from both causes declined. The net change is a decrease from 5.3 years in 2000 to 5.0 in 2023. The pattern in Canada is similar to that in the United States.
Men’s death rates are higher than women’s for most causes
There is a substantial gender gap for many of the most common causes of death, and for most of them the death rate is higher for men. Because cause-specific death rates feed into age-specific death rates, they directly affect life expectancy. By comparing death rates across countries and over time, we can begin to identify the factors most likely to contribute to the life expectancy gap.
I use cause-specific death rates from the Global Burden of Disease (GBD) study, produced by the Institute for Health Metrics and Evaluation (IHME). This dataset reports death rates by cause, sex, country, and year, using a consistent methodology.
Drug use disorders
It is likely that the widening U.S. gap between 2015 and 2020 was driven at least in part by the opioid epidemic. To see whether that explanation is plausible, I look at death rates from drug use disorders across OECD countries between 2000 and 2023.

Figure 2
The most notable feature is the increase in the United States and Canada after 2013, which aligns with the third and fourth waves of the opioid epidemic, attributed to synthetic opioids like fentanyl. (The “waves” of the opioid epidemic refer to successive periods dominated first by prescription opioids, then heroin, then synthetic opioids such as fentanyl, and most recently fentanyl combined with stimulants.) In the United States, the fourth wave peaked in 2022 with 107,000 deaths in a single year. Men account for about 70% of opioid overdose deaths. The pattern in Canada is similar, although the gaps are lower throughout.
In many other countries the gap declined slowly, with the steepest decline in Norway. Other than the United States and Canada, the biggest increases were in Lithuania and the United Kingdom.
Historically, the smallest gap was essentially zero, in Japan in 2013; in the most recent data, the smallest gap is in South Korea. In both countries, social stigma against illicit drug use, conservative prescribing practices, and strict narcotics controls likely limited opioid markets.
Homicide
In most countries, men are more likely to be victims of homicide. The following figure shows gender gaps in homicide death rates ( IHME labels this category “interpersonal violence”).

Figure 3
The smallest gap was in Norway in 2019, when the rate was 0.48 for men and 0.55 for women, one of the few instances where the female rate was slightly higher. Currently the smallest gap is in Switzerland where it is 0.47 for men and 0.45 for women.
The largest gap was in Colombia in 2002: the homicide rate was 158 per 100,000 for men and 18 for women, a difference of 140 (truncated in the chart). Homicide rates in Colombia in the early 2000s were among the highest in the world, driven by armed conflict, paramilitary violence, drug-trafficking networks, and weak state control in some regions. Nearly nine in ten victims were men. As homicide declined, the gender gap narrowed.
Excluding Colombia, the largest decreases were in the Baltic countries while the largest increases were in Mexico, Costa Rica, and the United States. In the United States, homicide rates for men and women both declined between 2000 and 2014 and the gap shrank. Since then the gap has widened, driven primarily by firearm homicides. A sharp rise in 2020 coincided with pandemic-related social disruption and increased gun purchasing with the rate among men rising much more than among women. The net effect is an increase from 6.6 in 2000 to 8.8 in 2023.
Suicide
As the American Institute for Boys and Men has highlighted, in every OECD country, men are more likely than women to die by suicide. The following figure shows gender gaps in suicide death rates (which IHME labels “self-harm”).

Figure 4
The gender gap is much higher in Lithuania than in any other OECD country, driven by extraordinarily high male suicide rates in the aftermath of post-Soviet economic disruption. Since 2000 those rates have fallen sharply. Other countries with large gaps are Latvia and South Korea, with over 20 deaths per 100,000. South Korea’s suicide rate rose sharply after the 1997 Asian financial crisis, especially among working-age and elderly men. Economic disruption, elderly poverty, alcohol use, and limited mental-health access are likely contributing factors. The countries with the smallest gaps—and lowest rates—are Turkey, Greece, and Israel, which may reflect cultural characteristics, classification practices, or both.
In the United States, suicide rates have risen for both men and women, but about three times faster for men. The gap grew from 14 per 100,000 in 2000 to 18 in 2023. In 2023, the rate for men was 24.2 per 100,000, almost four times the rate for women of 6.5 per 100,000. The increase has been driven in part by firearm suicides (which are more lethal), economic instability, declining labor-force attachment among less-educated men, substance abuse, and social isolation are likely contributing factors.
Road traffic
In every OECD country, road traffic death rates are higher for men than for women, in part because of greater exposure—that is, more miles traveled. The following figure shows gender gaps in road traffic death rates.

Figure 5
The largest change during this period is the decline in the road-traffic gender gap in Lithuania, from the worst in 2005 to close to the OECD average. This decline followed EU accession in 2004, which brought stricter enforcement, infrastructure investment, vehicle-safety improvements, alcohol-control measures, and speed enforcement to the country.
Another notable pattern is the divergence between Mexico and Costa Rica. In Mexico, the decline in the road traffic gender gap coincided with strengthened enforcement and road-safety initiatives. In Costa Rica, the increasing gap was driven by motorcycle deaths, even as deaths in automobiles declined.
In the United States, the gap narrowed slightly between 2000 and 2010, then grew from 10 in 2010 to 13 in 2023, driven primarily by rising death rates for men (from 17.5 in 2010 to 21 in 2023). The widening gap in the United States reflects both exposure and risk per mile. Men in the United States drive about 60% more vehicle miles per year than women, and a disproportionate share of those miles occur in higher-risk settings such as nighttime and rural driving. Adjusting for miles driven removes roughly half of the raw difference in fatality rates between men and women. But even per mile driven, men’s risk is higher—primarily because of higher rates of speeding, alcohol impairment, and lower seatbelt use.
The gap depends on policy, institutions, and social conditions
Across all of these cause-specific death rates, there are large differences between countries and large changes over time. The likely drivers fall into a few recurring categories:
- Historical shocks, such as the armed conflict in Colombia, the collapse of the Soviet Union, the Asian financial crisis, and the COVID-19 pandemic.
- Economic structure and labor-market conditions, including unemployment, deindustrialization, and elderly poverty.
- Social and institutional conditions, such as family structure, social isolation, mental-health access, and law-enforcement capacity.
- Cultural norms and behavioral patterns, including alcohol use, stigma around drug use, and norms surrounding risk-taking and help-seeking.
- Public health and safety policies, such as road-safety programs, alcohol-control reforms, narcotics regulation, and vehicle and firearm policies.
Because these cause-specific gaps are themselves contingent on policy, social conditions, and institutional quality—and because they feed directly into life expectancy (see the appendix for details on this relationship)—the life expectancy gap they produce is contingent on these factors as well.
In the United States, a few causes drive most of the gap
After showing that the gap varies across OECD countries, let’s now focus on the United States, where the policy stakes are clearest. From 2000 to 2023, the total contribution of cause-specific death rates to the life expectancy gap has increased, driven by a large increase in the contribution of drug use disorders and a smaller increase due to suicide. The contribution due to road traffic declined between 2000 and 2013, but it has increased since. These trends are in contrast to those seen in most other OECD countries, where the total contribution has decreased over the same period.

Figure 6
Using a panel model fit to OECD data (described in the appendix), I estimate the contribution of each cause of death to the life expectancy gap in a given country, and how much the U.S. gap would change if each cause-specific death-rate gap were reduced to the best level observed anywhere in the OECD over 2000–2023.
In 2023 the U.S. life expectancy gap was 5.0 years, close to the OECD average, and largely driven by three causes:
- Road traffic has the largest potential impact: reducing the death-rate gap to Iceland’s 2017 level would close the life expectancy gap by about 0.81 years.
- Drug use disorders are second: reducing the gap to Japan’s 2013 level (essentially zero) would close it by about 0.77 years.
- Suicide is third: reducing the death-rate gap from about 18 to 4 per 100,000 would close it by about 0.52 years.
For homicide, liver disease, cancer, and alcohol the potential impact is smaller but still meaningful; for childhood mortality and injury it is smaller still; and for COVID-19 in 2023 it is near zero. The following table shows, for each cause, the current U.S. death-rate gap, the smallest gap observed anywhere in the OECD panel (the target), where that target occurred, and the predicted change in the life expectancy gap if the U.S. reached it.

Figure 7
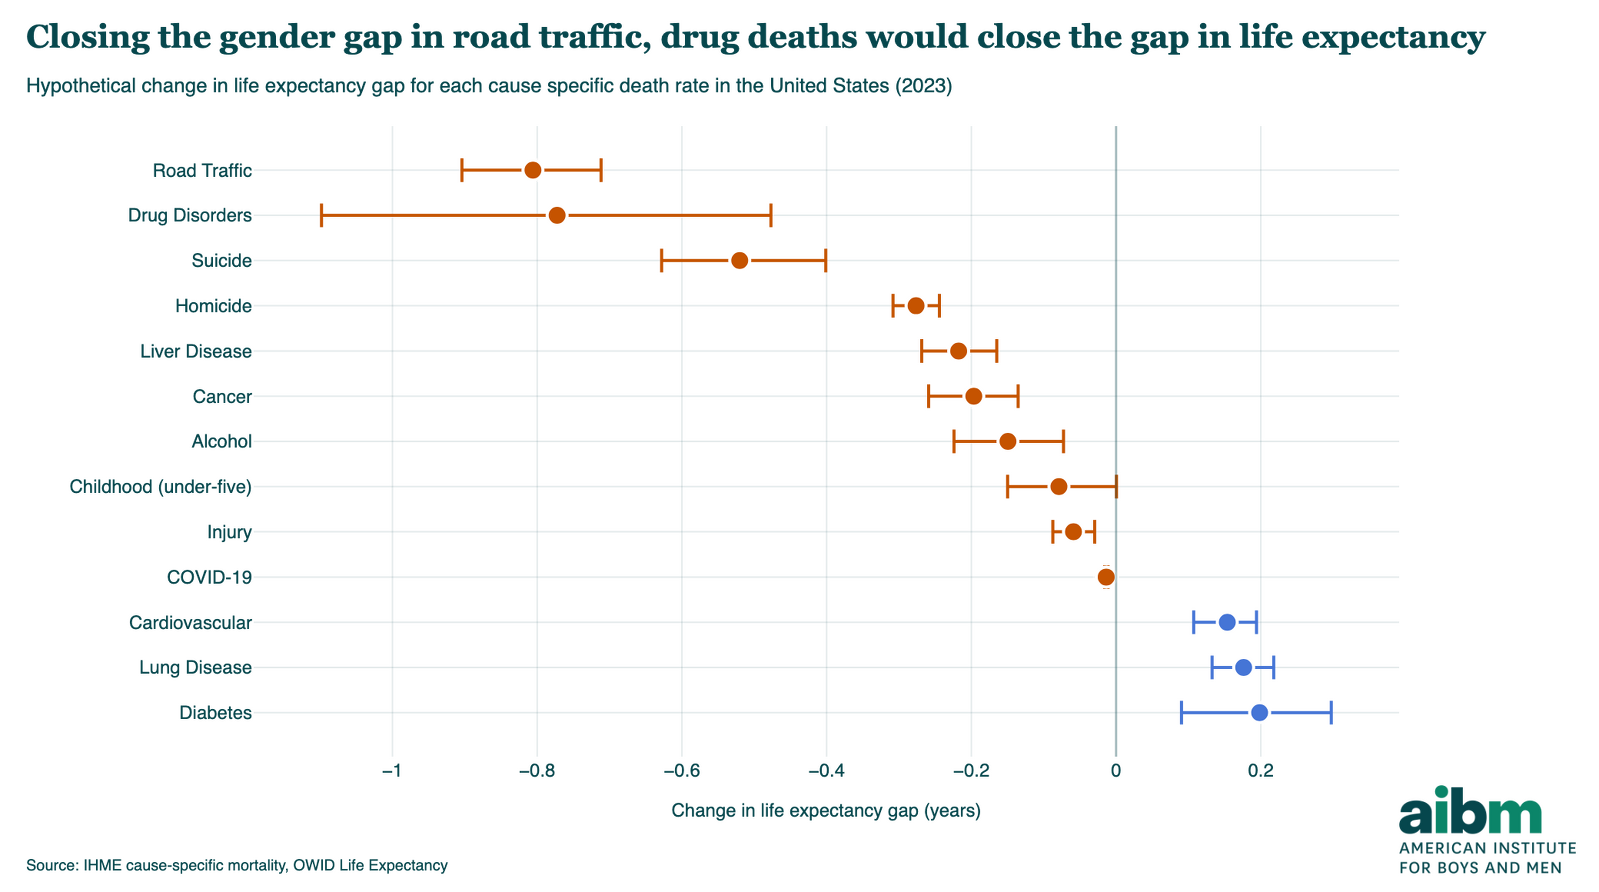
Figure 8
For lung disease the gender gap in the U.S. is negative—the death rate is higher for women—so closing it to zero would slightly increase the life expectancy gap. For cardiovascular disease and diabetes the model’s estimated effect is also positive (gap-widening) but this likely does not reflect a real policy trade-off. More likely, it reflects the fact that when fewer people die young from other causes, more people live long enough to die from diseases of aging like cardiovascular disease (see the appendix for additional details).
Overall, if the United States could close the gender gaps in cause-specific death rates to the lowest levels seen in other OECD countries, the life expectancy gap would shrink from 5.0 years to about 2.9 years. In reality these effects would interact—for example, reducing alcohol consumption would directly lower alcohol-related deaths and indirectly lower deaths from liver disease, cancer, road traffic, accidents, suicide, homicide, and possibly drug disorders—so the combined effect of multiple interventions could be larger or smaller than the simple sum. Even so, the magnitudes indicate which interventions have the most potential to narrow the gap.The leading contributors to the gap differ by region
For each country, I identify the cause that makes the largest contribution to the life expectancy gap, plus any additional causes contributing at least half as much. Each figure below shows the smallest observed value the gap could be closed to.
Data noteThe model-predicted gaps below may differ slightly from the observed gaps reported in other sections of this brief. For example, the observed gap in mortality between men and women in the U.S. was 5.0 years but the model-predicated gap was 5.37 years.
North America—drug use disorders and suicide are large contributors.
- United States (5.37 years): road traffic (−0.81), drug use disorders (−0.77), suicide (−0.52)
- Canada (4.61 years): drug use disorders (−0.51), cancer (−0.36), suicide (−0.34)
Canada is the only OECD country where drug deaths are the top factor. Closing that gap to the smallest observed level (essentially zero) would narrow Canada’s life expectancy gap by about half a year.
Latin America—road traffic is a leading factor in every country; in Mexico and Colombia, homicide is the top factor.
- Colombia (6.03 years): homicide (−1.61), road traffic (−1.48)
- Costa Rica (6.01 years): road traffic (−1.77)
- Mexico (4.93 years): homicide (−1.32), road traffic (−1.06), liver disease (−0.75)
- Chile (4.60 years): road traffic (−0.88), liver disease (−0.45)
Northern Europe—suicide is a leading factor in every country, and in most, cancer is as well.
- Finland (5.76 years): lung disease (−0.56), liver disease (−0.47), suicide (−0.39)
- Denmark (3.93 years): cancer (−0.47), suicide (−0.26), alcohol (−0.25), liver disease (−0.24)
- Norway (3.61 years): cancer (−0.33), suicide (−0.23)
- Sweden (3.45 years): suicide (−0.28), drug use disorders (−0.15), cancer (−0.14)
- Iceland (3.25 years): suicide (−0.37), cancer (−0.21)
Baltic countries—the gaps are bigger than in Northern Europe, but the leading factors are similar, including cancer and suicide.
- Latvia (9.73 years): cancer (−0.95), suicide (−0.83), road traffic (−0.71), cardiovascular (−0.59), lung disease (−0.53)
- Lithuania (8.78 years): suicide (−1.17), cancer (−0.87), liver disease (−0.60)
- Estonia (8.71 years): liver disease (−0.71), cancer (−0.66), suicide (−0.60), lung disease (−0.50), alcohol (−0.48), cardiovascular (−0.44)
Western Europe—the gaps are among the smallest. Cancer is a leading factor in every country; suicide, lung disease, and liver disease are also common.
- France (6.17 years): cancer (−0.84), suicide (−0.53)
- Portugal (5.92 years): cancer (−1.19)
- Spain (5.29 years): cancer (−0.94), lung disease (−0.71)
- Germany (4.81 years): cancer (−0.58), suicide (−0.44), liver disease (−0.42), lung disease (−0.35)
- Austria (4.77 years): suicide (−0.55), cancer (−0.44), liver disease (−0.38)
- Italy (4.43 years): cancer (−0.67), lung disease (−0.45), road traffic (−0.34)
- Belgium (4.38 years): lung disease (−0.61), cancer (−0.50), suicide (−0.50)
- United Kingdom (3.96 years): cancer (−0.36), suicide (−0.21), drug use disorders (−0.21), liver disease (−0.20)
- Switzerland (3.87 years): cancer (−0.41), suicide (−0.28)
- Ireland (3.84 years): cancer (−0.30), suicide (−0.19)
- Netherlands (3.40 years): cancer (−0.49)
- Luxembourg (3.39 years): liver disease (−0.27), cancer (−0.26), suicide (−0.17), lung disease (−0.17), cardiovascular (−0.15)
Eastern Europe—cancer, suicide, and liver disease are leading factors in every country.
- Poland (7.16 years): suicide (−0.66), cancer (−0.59), liver disease (−0.58), alcohol (−0.48), road traffic (−0.42)
- Slovakia (6.79 years): liver disease (−0.78), cancer (−0.67), suicide (−0.48)
- Hungary (6.24 years): liver disease (−0.94), suicide (−0.61), cancer (−0.53)
- Czechia (5.60 years): cancer (−0.53), suicide (−0.49), liver disease (−0.46), lung disease (−0.43), road traffic (−0.30)
- Slovenia (5.50 years): cancer (−0.68), suicide (−0.68), alcohol (−0.46), cardiovascular (−0.43), liver disease (−0.39), lung disease (−0.35)
Other OECD countries—patterns resemble Western Europe, with cancer and suicide often leading, along with road traffic.
- Australia (4.04 years): cancer (−0.50), suicide (−0.34)
- New Zealand (3.67 years): cancer (−0.31), suicide (−0.30), road traffic (−0.30)
- Greece (5.73 years): cancer (−1.11), road traffic (−0.61)
- Japan (6.88 years): lung disease (−1.19), cancer (−1.17)
- South Korea (6.78 years): cancer (−0.80), suicide (−0.75)
- Israel (3.69 years): road traffic (−0.18), cancer (−0.17), suicide (−0.11)
Nine of the 13 factors in the model appear as a leading factor in at least one country. Only four do not—unintentional injury, COVID-19, childhood mortality, and diabetes—although COVID-19 was a leading factor in some countries at the peak of the pandemic.
Policy can close the gap: Road safety and beyond
The single clearest lesson of this report is that policies aimed at the whole population can narrow the gender gap when they reduce causes of death that are more common among men. Europe’s experience with road safety is the strongest example, and the same logic extends to the other leading contributors.
A success story: Road traffic in Europe
Road traffic is a leading factor in only four EU countries and the top factor in none. That may be no coincidence. In the early 2000s the EU launched a coordinated effort to reduce traffic fatalities:
- A 2001 transport policy set the goal of cutting road deaths in half by 2010.
- The European Road Safety Action Programme (2003-2010) strengthened enforcement of speeding and drunk-driving laws and encouraged seatbelt use, safer road design, and improved vehicle-safety standards.
- A follow-on program (2011-2020) added protections for pedestrians and cyclists and vehicle features such as automatic emergency braking and lane-departure warnings.
These policies were not targeted specifically at men, but because traffic death rates are higher for men, the reduction in their rates was larger. As a result, in every European country the contribution of traffic deaths to the life expectancy gap fell between 2000 and 2023.

Figure 9
The declines are largest in Eastern and Southern Europe, where traffic death rates were highest. In five countries the life expectancy gap due to traffic fell by more than a year; in another eleven, by more than 0.5 years; and in six the remaining contribution is now less than 0.1 years—which suggests it is possible to all but eliminate the gender gap in road-traffic deaths.
A general point follows from this example. There are two ways to reduce a cause-specific death-rate gap. The first is obvious: an intervention targeted at men that lowers their death rate more than women’s will shrink the gap. The second is less obvious but just as important: an intervention that helps men and women equally—lowering both rates by the same percentage—also shrinks the gap, because men start from a higher rate. For instance, U.S. drug-use-disorder death rates in 2023 were 41 per 100,000 for men and 17 for women (a gap of 24); cutting both by half would reduce death rates for men to 20.5 and for women to 8.5 (a gap of 12). This is why gender-neutral policies can still deliver gendered benefits.
The other leading contributors are also amenable to change
Road traffic in Europe shows how public health and safety policy can narrow the life expectancy gap. The other leading contributors appear similarly responsive to intervention.
Drug use disorders. The scale of the opioid epidemic in the United States and Canada was avoidable. Other high-income countries avoided harms on the same scale by maintaining stricter controls on opioid prescribing, adopting prescription-monitoring systems earlier, limiting pharmaceutical marketing, and expanding harm-reduction measures. Deaths from drug use disorders have begun to decline in the United States and Canada (though the causes are not yet clear); if these trends continue, this component of the gap should shrink.
Alcohol. The Baltic countries and Poland adopted alcohol-control policies—tax increases, availability restrictions, and marketing limits—that reduced alcohol-attributable mortality and contributed to declines in liver disease and suicide. A decrease in alcohol use directly reduces alcohol-related deaths and indirectly reduces deaths from homicide, suicide, road traffic, liver disease, and cancer. In many OECD countries, alcohol use is falling, with lower rates of drinking among recent cohorts. If these patterns persist, alcohol’s contribution to the gap should decrease as well.
Smoking. Smoking rates have declined in most OECD countries, driven by higher taxes, smoke-free laws, advertising bans, graphic health warnings, and restrictions on sales to minors. Because more men smoke, and may suffer greater harm from it, declining smoking should reduce the contributions of lung disease, cardiovascular disease, and cancer to the gap.
Cancer. According to a recent study across 185 countries, almost 40% of new cancers are preventable—attributable to factors including smoking, alcohol, obesity and physical inactivity, air pollution, solar radiation, infection, and occupational exposure. Many of these factors respond to public health and safety policy. The study notes that the share of preventable cancers is higher in men, which suggests that reducing cancer death rates would have a larger effect on men and narrow the gap.
Suicide. In most OECD countries the contribution of suicide to the gap fell between 2000 and 2023, with the biggest declines in the Baltic and Central European countries from improving economic conditions after the post-Soviet transition, stronger alcohol control, and national suicide-prevention strategies. Similar declines occurred in Finland, Ireland, and Japan following coordinated interventions. At the same time, the contribution of suicide rose by 0.11–0.14 years in the United States, Mexico, and Costa Rica, and by 0.34 years in South Korea—patterns linked to economic insecurity, job loss, social isolation, and uneven access to mental-health care.
Homicide. In most OECD countries, homicide contributes less than 0.05 years to the gap and has changed little since 2000. The largest decline was in Colombia, where the contribution fell from 4.17 to 1.61 years, reflecting state security policies, demobilization of paramilitary groups, the reduction of armed conflict, and violence-prevention efforts in major cities. In Estonia, Latvia, and Lithuania, the contribution fell by 0.25–0.52 years as economic conditions stabilized. It rose by 0.3 years in Costa Rica and 0.7 years in Mexico, driven by violence associated with organized crime and drug trafficking.
These examples show that the leading causes of the life expectancy gap are contingent: they depend on economic and social conditions and are amenable to public health and safety policies.
Healthy life expectancy
So far, I’ve focused on period life expectancy, but I also ran the same analysis for healthy life expectancy (HALE), which is the expected number of years lived in good health. Over time, HALE in most OECD countries has increased for both men and women, and the gap has narrowed.
The following figure shows the gender gap in HALE (women minus men) for OECD countries from 2000 to 2023.

Figure 10
In 2023, the average HALE gap was 2.2 years, smaller than the average life expectancy gap of 5.1 years. This difference suggests that some of the additional years women live are not spent in good health. The trends in HALE track those in life expectancy: decreasing in most countries (except during the COVID-19 pandemic) and increasing in the United States and Canada, primarily from opioids.
The 2025 Global Gender Gap Report (GGGR) notes these decreasing gaps and concludes that “while overall life expectancy by gender has remained more stable than healthy life expectancy, and women continue to outlive men, this indicates that the proportion of women’s lives spent in full health has declined relative to men.” This phrasing can make it sound as though women’s health outcomes are getting worse. They are not. The issue is similar to the one Richard Reeves and I identify in AIBM’s critique of GGGR’s index: the interpretation of a health gap depends heavily on the benchmark used. In this case, narrower HALE gaps often reflect men catching up, not women falling behind. The next figure shows HALE over time for OECD countries—green lines for men, purple for women—highlighting the countries with the largest and smallest gaps, Lithuania and Norway.

Figure 11
The HALE gap is narrowing in 34 of 37 countries—and in every one of them HALE is increasing for both men and women. Because men generally have worse health outcomes, as outcomes improve they improve faster for men, which closes the gap.
Contributions to the HALE gap
Using the HALE data, I ran a panel model with the same predictors as the life expectancy model. The causes with the highest coefficients are mostly the same in both models. The biggest difference is lung disease, which has the fifth-largest coefficient in the life expectancy model but moves up to second in the HALE model; the other differences are small and within expected variability.

Figure 12
I used the model to estimate counterfactual HALE for the United States in 2023, again assuming each death-rate gap could be lowered to the best observed value.

Figure 13
The leading contributors are the same as in the life expectancy model. The top factor is road traffic: reducing the death-rate gap from 13 to 1.92 per 100,000 would narrow the HALE gap by about 0.86 years.

Figure 14
The HALE trends are consistent with the life expectancy trends: the total has generally increased, driven by a large increase in the contribution of drug use disorders and smaller increases from suicide and road traffic.
Excess male mortality is a preventable public-health problem
The main lesson of this report is that excess male mortality should be treated as a measurable and partially preventable public-health problem—not as a fixed biological benchmark.
Some argue that men are simply more inclined toward risky behavior, and that the gap therefore reflects something unavoidable. Several causes in this piece are linked to behavior: smoking (lung disease, cardiovascular disease, cancer) and drinking (liver disease, cancer, road traffic, homicide, suicide, accidental injury, and alcohol-related deaths). But even where risk-taking contributes, that does not make the gap inevitable. Exposures and behaviors are themselves shaped by the environment—alcohol and tobacco availability and marketing, opioid supply, vehicle design and road infrastructure, firearm access, and labor-market conditions. One estimate, by Movember using 2023 data, put the costs of men’s premature mortality at $421 billion in the United States alone. They also estimated that 85% of these costs may be preventable through public health measures, timely care, and changes to environmental conditions. We have seen repeatedly that health and safety policy can both reduce risky behavior (like drunk driving) and reduce its consequences (for example, through safer roads and vehicles), just as public campaigns and medical advances reduced both smoking and its harms.
Two conclusions follow.
First, gender-neutral policies can still have gendered benefits. Road-safety laws, safer vehicles and infrastructure, overdose prevention, suicide prevention, alcohol control, smoking reduction, and violence prevention all improve population health. But because men typically face higher death rates from these causes, successful interventions also narrow the gap between women’s and men’s life expectancy. The gap varies widely across otherwise comparable countries, and many have narrowed it over time—a pattern hard to reconcile with the idea that the current gap is fixed.
Second, for the United States, the strongest near-term priorities are road traffic safety, drug overdose prevention and harm reduction, and suicide prevention. These are not the only contributors, but they are large, policy-relevant, and already connected to existing intervention strategies. Reducing these deaths would save lives directly—and would also narrow one of the most persistent gender disparities in health.
Methodological appendix
This appendix summarizes the quantitative methods behind the policy-facing narrative in the body of the report.
How cause-specific death rates relate to life expectancy
Life expectancy is calculated from age-specific death rates. When men die at higher rates than women from a particular cause, those deaths raise men’s age-specific death rates and contribute to the overall life expectancy gap. Put simply: if policies reduce the death-rate gaps for major causes, the life expectancy gap should narrow too. This is the sense in which I treat these factors as causal—both counterfactually (if the death-rate gaps were smaller, the life expectancy gap would be smaller) and as policy levers (if an intervention reduces these rates, it should reduce the life expectancy gap).
Data
Life expectancy and the life expectancy gender gap (female minus male years): Our World in Data, combining life-table inputs from the Human Mortality Database (2025) and the United Nations World Population Prospects (2024 revision), with other national sources where OWID harmonizes series. Calendar years 2000–2023; 38 OECD countries, with 37 in the regression model after excluding Turkey.
Cause-specific mortality and male–female gaps in death rates: IHME Global Burden of Disease cause-specific death rates by age, sex, country, and year, aggregated to the cause groups used in the model (e.g., road traffic injuries, self-harm, interpersonal violence, neoplasms, chronic respiratory disease, substance use and related categories, cardiovascular disease, diabetes, COVID-19, all-cause under-five mortality). The outcome series (OWID) and predictor series (IHME) are aligned in a country–year panel. HALE is the expected years of good health from the same source.
Panel regression model
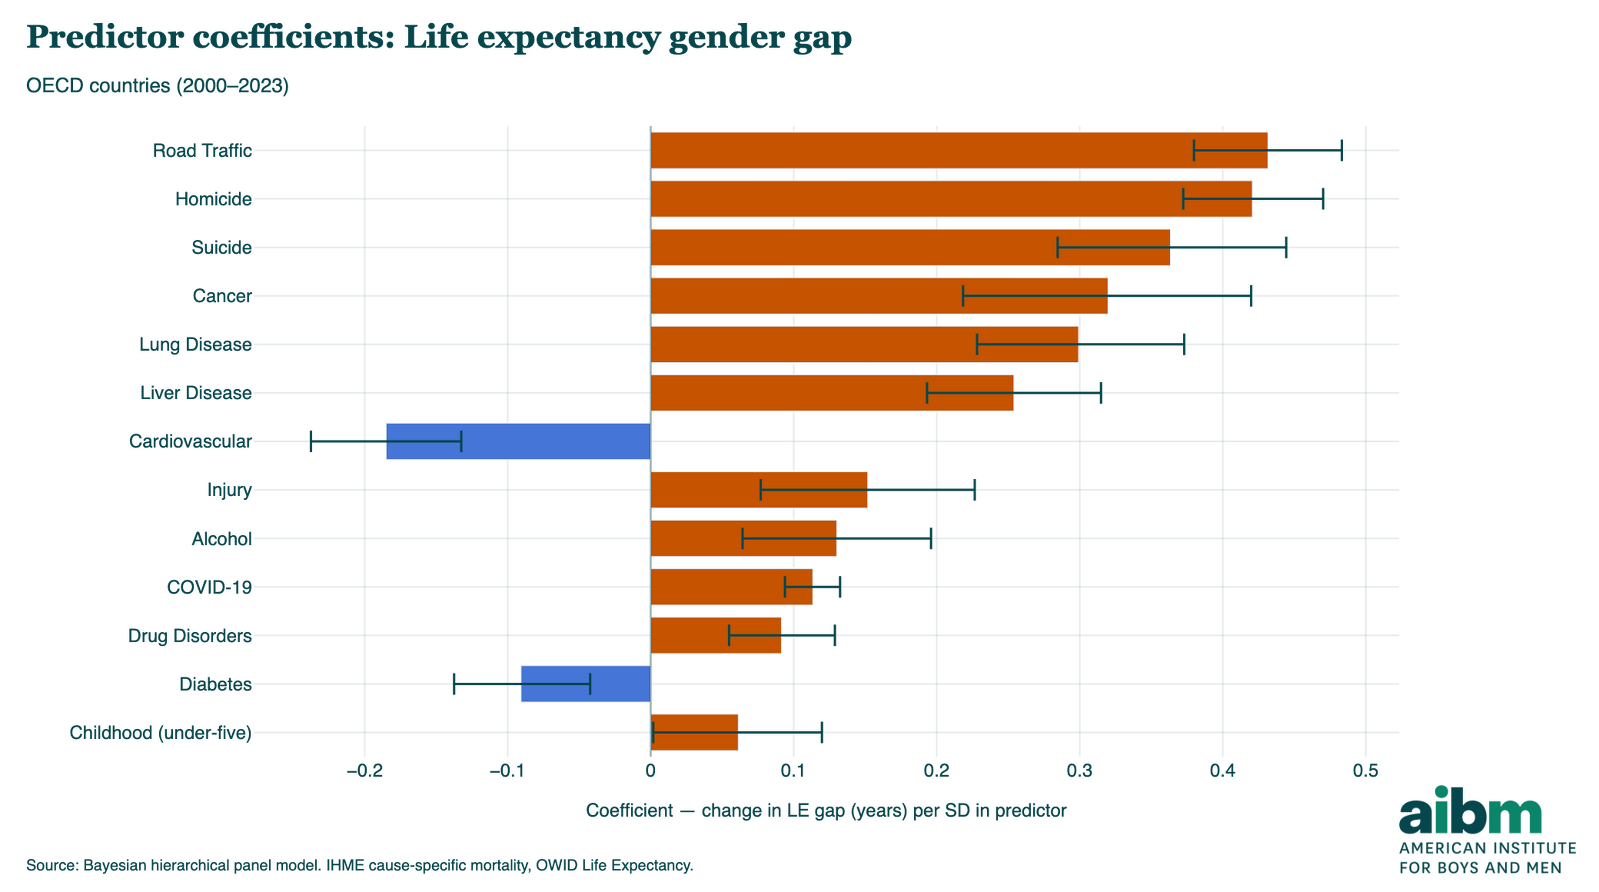
I built a Bayesian hierarchical linear model fit to 888 country—year observations (37 countries × 24 years). It regresses the life expectancy gender gap on standardized male—female gaps in 13 cause-specific death rates from the GBD study: alcohol, suicide, homicide, road traffic injuries, cardiovascular disease, diabetes, cancer, lung disease, liver disease, unintentional injury, drug use disorders, childhood (under-five) mortality, and COVID-19.
In plain terms, the model estimates which causes of death are most strongly associated with larger life expectancy gaps across countries and over time. Predictors are standardized and the outcome gap is centered, which stabilizes sampling and keeps the intercept interpretable. Each cause-specific coefficient is shared across countries and interpreted as the expected change in the life expectancy gap per one-standard-deviation increase in that cause’s death-rate gap, holding other gaps constant. A positive coefficient means that when a death-rate gap is larger (men dying at higher rates than women), the life expectancy gap is larger (women living longer). Each country also has a random intercept capturing persistent over- or under-prediction; the gaps in Estonia, Latvia, and South Korea are larger than the model predicts, and Mexico’s is smaller, which may reflect omitted predictors, interactions, or measurement error.
The model achieves a mean absolute error on the order of 0.2 years on the life expectancy gap—substantially smaller than one year for most country-years. Residuals are centered near zero for most countries; some show larger dispersion, consistent with small-population noise or omitted drivers. Maternal disorders and conflict/terrorism were examined but dropped (small coefficients, credible intervals crossing zero, negligible fit gains). Turkey is excluded from the regression because it behaves as a multivariate outlier; descriptive tables include all 38 OECD members.
Appendix Figure 1
Road traffic deaths have the largest coefficient—about 0.43 years per standard deviation. Put plainly: a country that is average in every way except that its gender gap in traffic deaths is one standard deviation above the mean is expected to have a life expectancy gap about 0.43 years above average. Countries where men die much more often than women in traffic crashes tend to have larger life expectancy gaps. Other factors with large coefficients are homicide, suicide, cancer, lung disease, and liver disease.
The magnitudes depend on both death rates and the ages of those affected. Cancer and respiratory disease have high rates but mostly affect older people, so their effect on life expectancy is attenuated; homicide and suicide have lower rates but affect younger people, so their effect is amplified. Child mortality affects the youngest people, so each death removes many potential years—but its estimated coefficient is small with a lower credible bound near zero, because in most OECD countries the gender gap in child mortality is already small and changes slowly. Alcohol’s coefficient is relatively small partly because of classification: in the GBD database, alcohol-related deaths are defined narrowly and exclude indirect effects (liver disease, cancer, road traffic, homicide, suicide, accidental injury) where alcohol is often a contributing factor. Smoking is not a separate category but contributes to gaps in cancer, cardiovascular disease, respiratory disease, and possibly COVID-19.
Counterfactual scenarios
To indicate what is achievable, I take each cause’s male–female death-rate gap to the minimum gap observed anywhere in the OECD panel over 2000–2023. The following table shows that minimum gap (deaths per 100,000), and where it occurred.

Appendix Figure 2
Several causes have a negative minimum gap, meaning that in some places and times the usual pattern reverses and death rates are higher for women. For these causes, I assume that if the gap can be negative or positive, it can also be zero, and use zero as the target. Some gaps may be harder to close than others—the smallest observed suicide gap is about 4 per 100,000 (Greece, 2002) against an OECD average near 14—so to be conservative I treat the smallest observed gap as the smallest attainable. Scenarios are partial: they move one cause at a time, so summing across causes is not a joint-intervention forecast.
Competing risks
In both models, the estimated coefficients for cardiovascular disease and diabetes are negative—implying that a larger death-rate gap is associated with a smaller life expectancy gap. This is counterintuitive: if more men die of cardiovascular disease, their death rates should rise and their life expectancy fall. A likely explanation is competing risks. Where death rates from other causes are low, cardiovascular disease and diabetes—diseases of aging—become more common simply because more people live long enough to die from them. In the regression, these variables may act as a proxy for overall health: if a large (positive) death-rate gap signals good general outcomes, and good outcomes are associated with smaller life expectancy gaps, that would explain the negative coefficients. If so, the counterfactual assumption may not hold for these causes—it is not clear what effect reducing these particular gaps would have on life expectancy.
Subscribe to our newsletter
Get the latest developments on the trends and issues facing boys and men.
Related Research

Health
Young men and cryptocurrency: What the evidence shows
David Sasaki and Diego Nunez review recent evidence on cryptocurrency trading, which has become a mainstream financial activity in the U.S. especially among young men.

Health
Marijuana use among men hits new highs
Marijuana use is rising among U.S. men, especially ages 26–34, with higher daily use and cannabis use disorder rates than women.

Health
Data Spotlight: Suicide deaths among young men
Male suicide rates are rising—especially among young men. Explore key trends, data, and years of life lost from 2001–2023.