ResearchEmployment, Education & Skills
How NEETs spend their time

Key takeaways:
- NEETs—those between the ages of 16-24 not in education, employment, or training—spend more time than non-NEETs on leisure (6.7 vs. 4.3 hours per day) and taking care of family and household (2.6 vs. 1.4 hours. per day).
- On average, female NEETs spend more time caring for others and supporting their households than male NEETs (3.5 vs. 1.9 hours per day).
- Both male and female NEETs spend roughly 5 hours per day watching TV and engaging in “other” leisure activities, but male NEETs spend roughly 2 additional hours per day playing video games.
- NEET men are spending significantly more time alone (7.8 hours per day) than they were in the early-2000s and relative to female NEETs (4.6 hours) and non-NEET men (5.6 hours).
Introduction
Over the last several years, journalists and academics have paid increasing attention to men’s disconnectedness—see this work from the Atlantic, New York Times, and Financial Times, for example. In a previous piece, AIBM researchers looked at male NEETs, or those men not in education, employment, or training, and found that, contrary to some popular narratives, young men are no more likely to be classified this way than women: 12% of men aged 16-24 are classified as NEET compared to 13% of women.
A closer look at time-use data shows that NEET status carries different implications for men and women. This brief examines how NEETs and non-NEETs allocate their time, how time use differs between male and female NEETs, and how these patterns have changed over the past two decades. The data shows that for many young women, NEET status often reflects unpaid caregiving responsibilities. For men, by contrast, it appears to signal a deeper form of disengagement—not only from the labor market and education, but also from social life.

Figure 1: Average daily time use by NEET status, 2021-2024
For our purposes, a “non-NEET” is someone who works (at least part time), is enrolled in school (at least part time), or is currently participating in a job training program. Figure 1 shows the average amount of time per day that NEETs and non-NEETs spend across ten mutually exclusive activity categories. Playing video games is coded in the American Time Use Survey (ATUS) as “playing games” and does not distinguish between video games and other types of games. The “other” activity category includes time spent in self-care activities, religious activities, exercise, talking on the phone, traveling, and preparing and consuming food.
Data noteAll of the following analyses rely on the American Time Use Survey (ATUS), a nationally representative survey conducted annually by the U.S. Census Bureau. The ATUS has two parts: a demographic questionnaire and a 24-hour activity diary for a randomly selected day. I use the demographic portion of the survey to identify those who are NEETs—defined here as individuals aged 16-24 who are not working, enrolled in school, or participating in job training. Because the ATUS records hundreds of highly specific activities—ranging from sleeping and bathing to attending concerts or going to the grocery store—I group all activities into one of ten mutually exclusive categories:
- Watching TV
- Playing Video Games
- Other Socializing, Relaxing, and Leisure
- Work and Education
- Searching for Work
- Volunteering and Civic Obligations
- Errands and Housework
- Caretaking
- Sleeping
- Other
Activities and shifts over time
NEETs spend significantly more time than non-NEETs in leisure activities. On average, they spend 2.6 hours per day watching TV, 1.6 hours playing video games, and another 2.5 hours in other leisure activities—totaling 6.7 hours of leisure time per day. For comparison, non-NEETs average only 1.8 hours watching TV, 0.9 hours gaming, and 1.6 hours in other leisure activities for a total of 4.3 hours of leisure per day. And, by definition, NEETs spend little time working or in education—just 0.3 hours per day—compared to 4.9 hours for non-NEETs.
NEETs also shoulder heavier household and caretaking responsibilities. Non-NEETs spend an average of 1.4 hours per day caring for others, doing housework, and running errands, compared to 2.6 hours for NEETs.
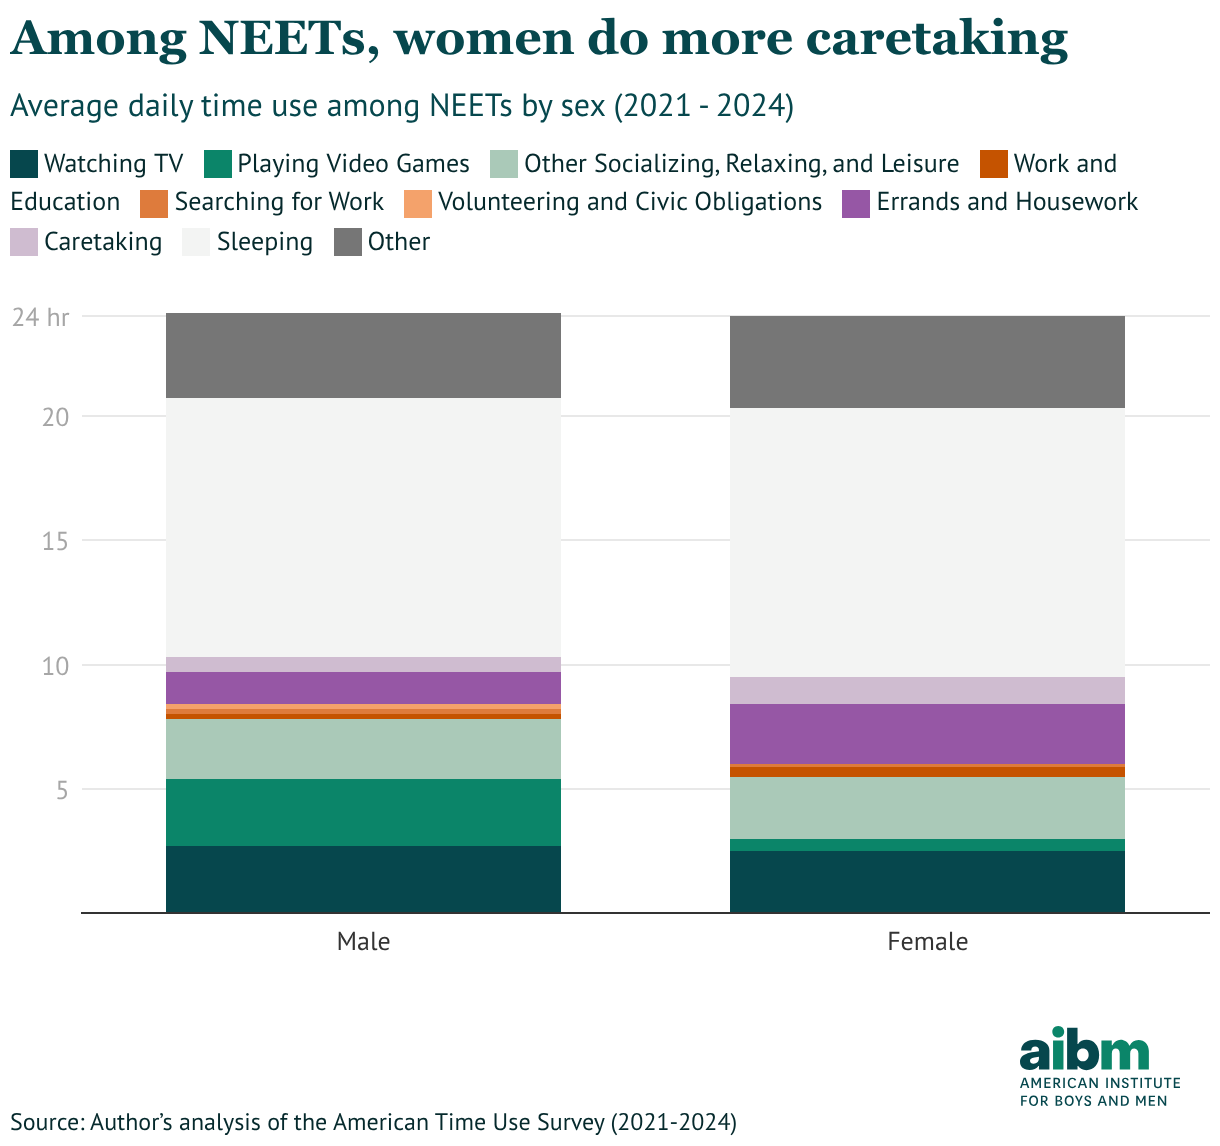
Figure 2: Average daily time use among NEETs by sex, 2021-2024
Many NEETs clearly face significant caretaking and household responsibilities. Yet, as previous AIBM research has shown, female NEETs are particularly likely to be parents of young children, suggesting that these responsibilities may fall disproportionately on them. To explore gender differences in time use among NEETs, figure 2 plots the average daily hours for male and female NEETs across the ten activity categories.
Overall, female NEETs spend more time caring for others and supporting their households. Female NEETs average 3.5 hours per day in such activities, compared to 1.9 hours per day for male NEETs.
Data noteThe ATUS distinguishes between several measures of child caretaking. Primary child care refers to time in which caring for a child is reported as the respondent’s main activity (e.g., feeding, bathing, helping with homework). Secondary child care captures time in which the respondent is responsible for a child while engaged in another primary activity (e.g., cooking or watching television while supervising a child). The gap between male and female NEETs widens when accounting for childcare as a secondary activity. When this childcare is included, female NEETs spend 5.7 hours per day caring for others and managing the household, compared to 2.6 hours for men.
Finally, “time with children” measures all time spent in the presence of a child, regardless of whether any caregiving responsibility is reported. While primary and secondary child care are mutually exclusive, time with children can include primary or secondary child care. In the figure above, “caretaking” includes primary child care along with time spent caring for adults. It does not include secondary child care or time in which the individual is merely in the presence of a child.
Male NEETs, by contrast, spend more time in leisure. While female NEETs average 5.5 hours per day in leisure activities (watching TV, playing video games, and other leisure), male NEETs spend 7.8 hours per day in those activities. Interestingly, much of the difference in leisure time is attributable to men’s time gaming. Both male and female NEETs spend roughly 5 hours per day watching TV and engaging in “other” leisure activities, but male NEETs spend roughly 2 more hours per day playing video games than female NEETs.
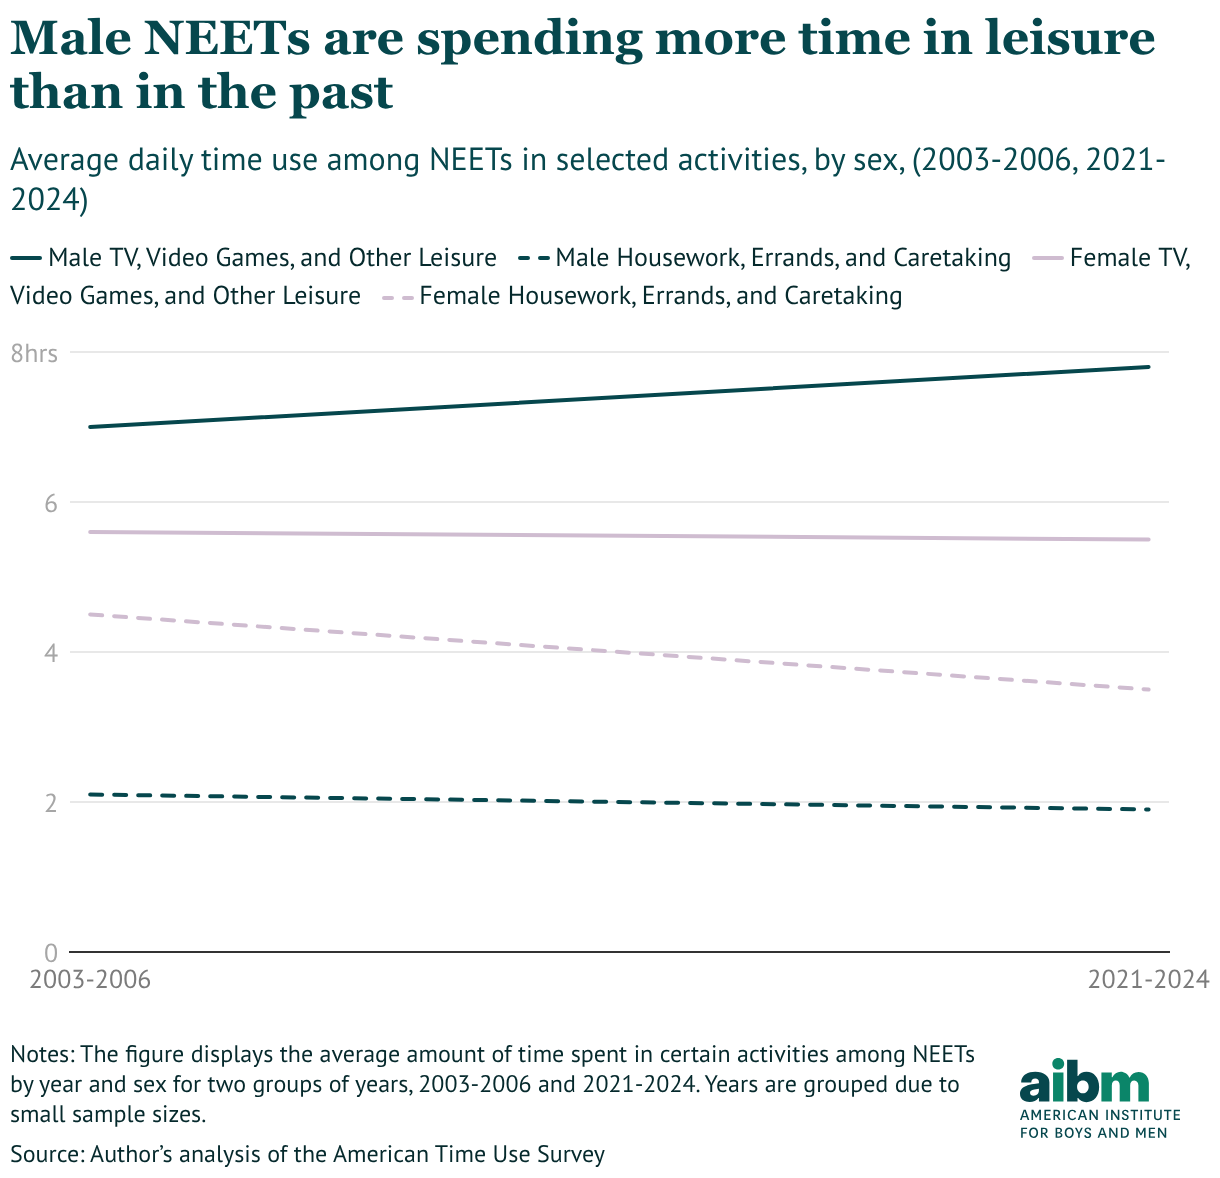
Figure 3: Average daily time use among NEETs in selected activities, by sex, 2003-2006 and 2021-2024.
The ATUS began collecting data on Americans’ time use in 2003, making it possible to see whether these gendered patterns are recent or persistent. Figure 3 shows how NEETs time use has changed over time, plotting the average amount of time that male and female NEETs spend in leisure activities (watching TV, playing video games, and other leisure) and caretaking and household management (caring for others, running errands, and doing housework).
Since the ATUS began collecting data, male NEETs have consistently spent more time than female NEETs in leisure. Male NEETs’ leisure time has increased by roughly an hour per day (7.0 to 7.8 hours per day), and the gender gap in leisure time among NEETs has increased from 1.4 hours to 2.3 hours per day. The opposite is true when it comes to housework and caretaking; the gender gap in caretaking and housework has declined over time but still remains at over an hour per day. This data highlights that gender disparities in time use among NEETs are persistent; male NEETs consistently spend more time in leisure and female NEETs consistently spend more time in caregiving and domestic work.
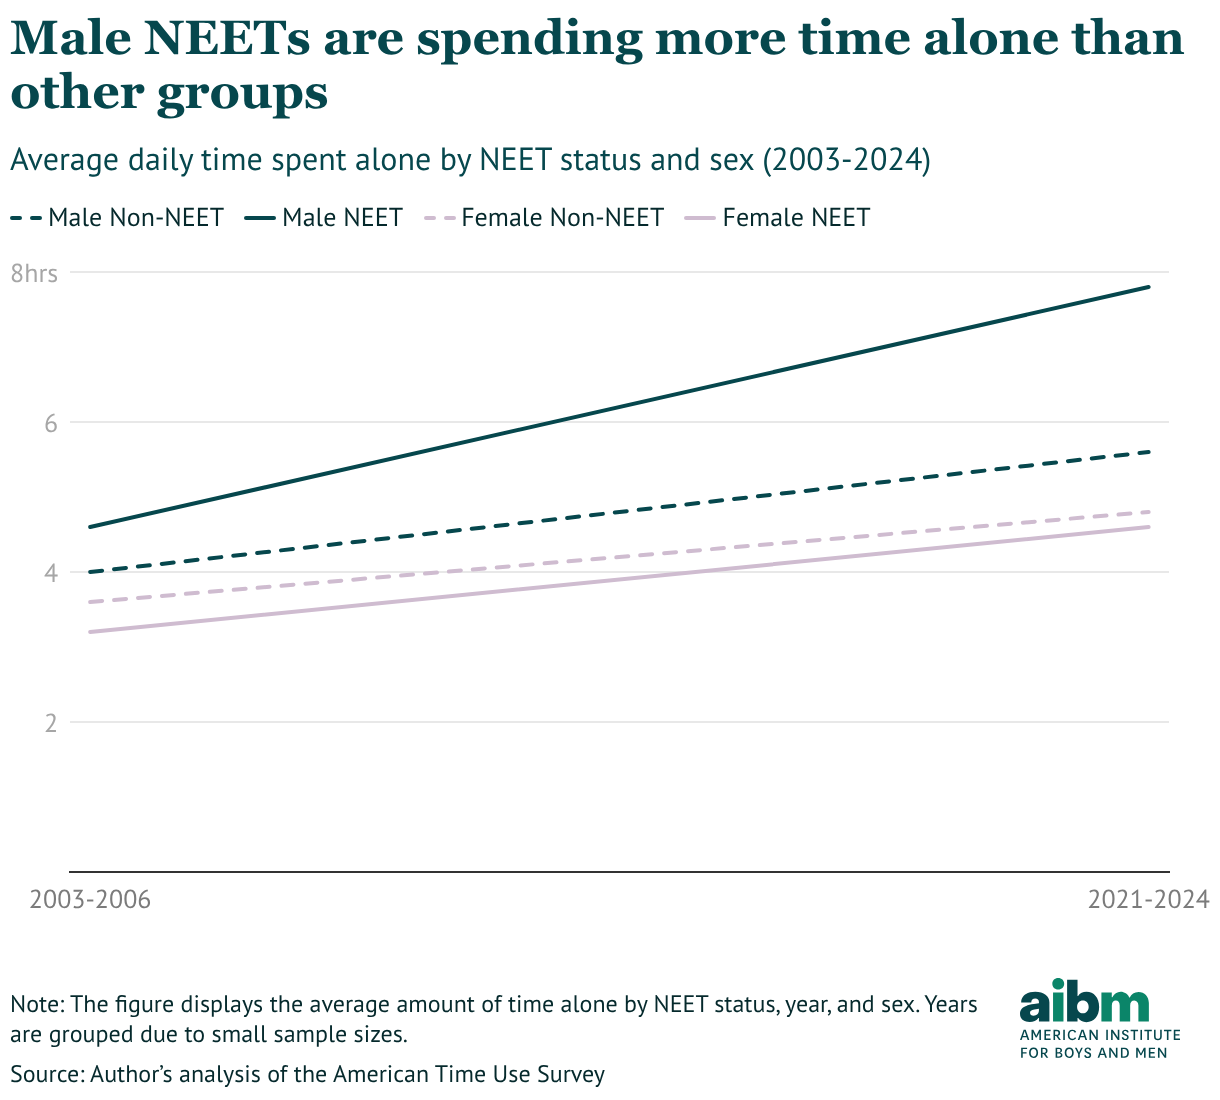
Figure 4: Average daily time spent alone by NEET status and sex, 2003-2024
Despite devoting a large share of their waking hours to leisure, male NEETs are among the most socially isolated young people. Figure 4 plots, for each group of years, the average time that male and female NEETs—and their non-NEET counterparts—spend alone.
Data noteFor each activity in the ATUS, the survey asks respondents to record whether anyone accompanied them while doing the activity, and if so, whom. Certain activities, such as sleeping and bathing are not asked the “who” questions. Prior to 2010, the ATUS did not ask the “who” questions for work-related activities. For consistency, I exclude work-related activities, sleeping, and personal care activities from the results.
Although NEETs and non-NEETs are both spending more time alone, male NEETs now spend significantly more time alone than each of the other comparison groups. In the most recent years of data, NEET men spent an average of 7.8 hours alone per day—the same amount of time spent in leisure. These findings highlight a troubling pattern: NEET men are not only disconnected from school and work, but also from social life. By contrast, female NEETs average 4.6 hours alone per day—the lowest of any group examined.
Conclusion
Overall, young men and women are about equally likely to be NEETs—not in education, employment, or training. Yet time use data reveals substantial differences in their daily lives. Female NEETs spend more time caring for others and supporting their households, while male NEETs spend more time watching TV, playing video games, or otherwise relaxing.
Despite this abundance of leisure time, male NEETs also appear to be the most socially isolated—spending roughly eight hours per day alone. Taken together, the evidence points to sharply different realities: for many women, NEET status indicates the demands of caretaking and household management, while for many men, it signals deeper withdrawal from the labor market, education, and social life.
Subscribe to our newsletter
Get the latest developments on the trends and issues facing boys and men.
Thomas O’Rourke is a doctoral student in Sociology and Social Policy at Princeton University.
Related Research

Employment, Education & Skills
Will more recess help boys in school?
Does recess help boys in school? A research summary on behavior, focus, learning outcomes, and what the evidence shows.

Employment, Education & Skills
Data Spotlight: Gender gaps across life
U.S. gender gaps across life: men lag in education, health & incarceration; lead in earnings & employment. See the age-by-age data.

Employment, Education & Skills
“School’s not cool”: How peer pressure can hurt boys’ education
Peer pressure and masculine norms discourage boys—especially disadvantaged ones—from visible academic effort, widening education gaps.