ResearchEmployment
Occupations by gender: The facts

Summary
The American labor market has changed dramatically over the past several decades, reshaped by shifts in both who is working and the nature of work. While recent discourse has focused on the “feminization” of professions, the broader trends are nuanced: many previously male-dominated fields have moved toward gender parity, while others remain predominantly male or female. Women remain scarce in many technical and manual fields, while men are largely absent from health and education roles. Importantly, both men and women have experienced profound changes in the kinds of work they do — including the decline of production and office work, and the rise of computing, healthcare, and other service-sector jobs. Understanding these shifts through data rather than assumptions helps clarify what’s truly changing and where the economy is headed, for both men and women.
Key takeaways
- The labor market has moved toward parity: Men comprised 53% of prime-age workers in 2024 — a stable figure since 1992, but down sharply from 1968.
- Most occupations that changed moved toward gender balance: Professions including management, legal, and life sciences all shifted from heavily male-dominated to near parity, some now leaning slightly majority-female.
- Some fields remain deeply gender-skewed: Manual and technical professions are still heavily male, while healthcare and teaching have few, and indeed declining shares, of men.
- The economy became more occupationally diverse for men: In 1968, three job categories — production, management, and transportation — employed half of all men; in 2024, they employed 31%.
- Structural shifts reshaped work for both genders: Production employment dropped from 20% to 7% for men and 17% to 3% for women, while office work fell from 30% to 14% for women. New sectors emerged: computing now employs 7% of men, healthcare 12% of women.
Over the past several decades, the American labor market has changed dramatically in both the nature of work and the composition of the workforce. One key trend is the dramatic increase in the share of women in the labor market: in 1968, about 65% of workers aged 25-54 were men; by 1992, that share had fallen to 54%. Since then, it has remained stable, as shown in Figure 1.
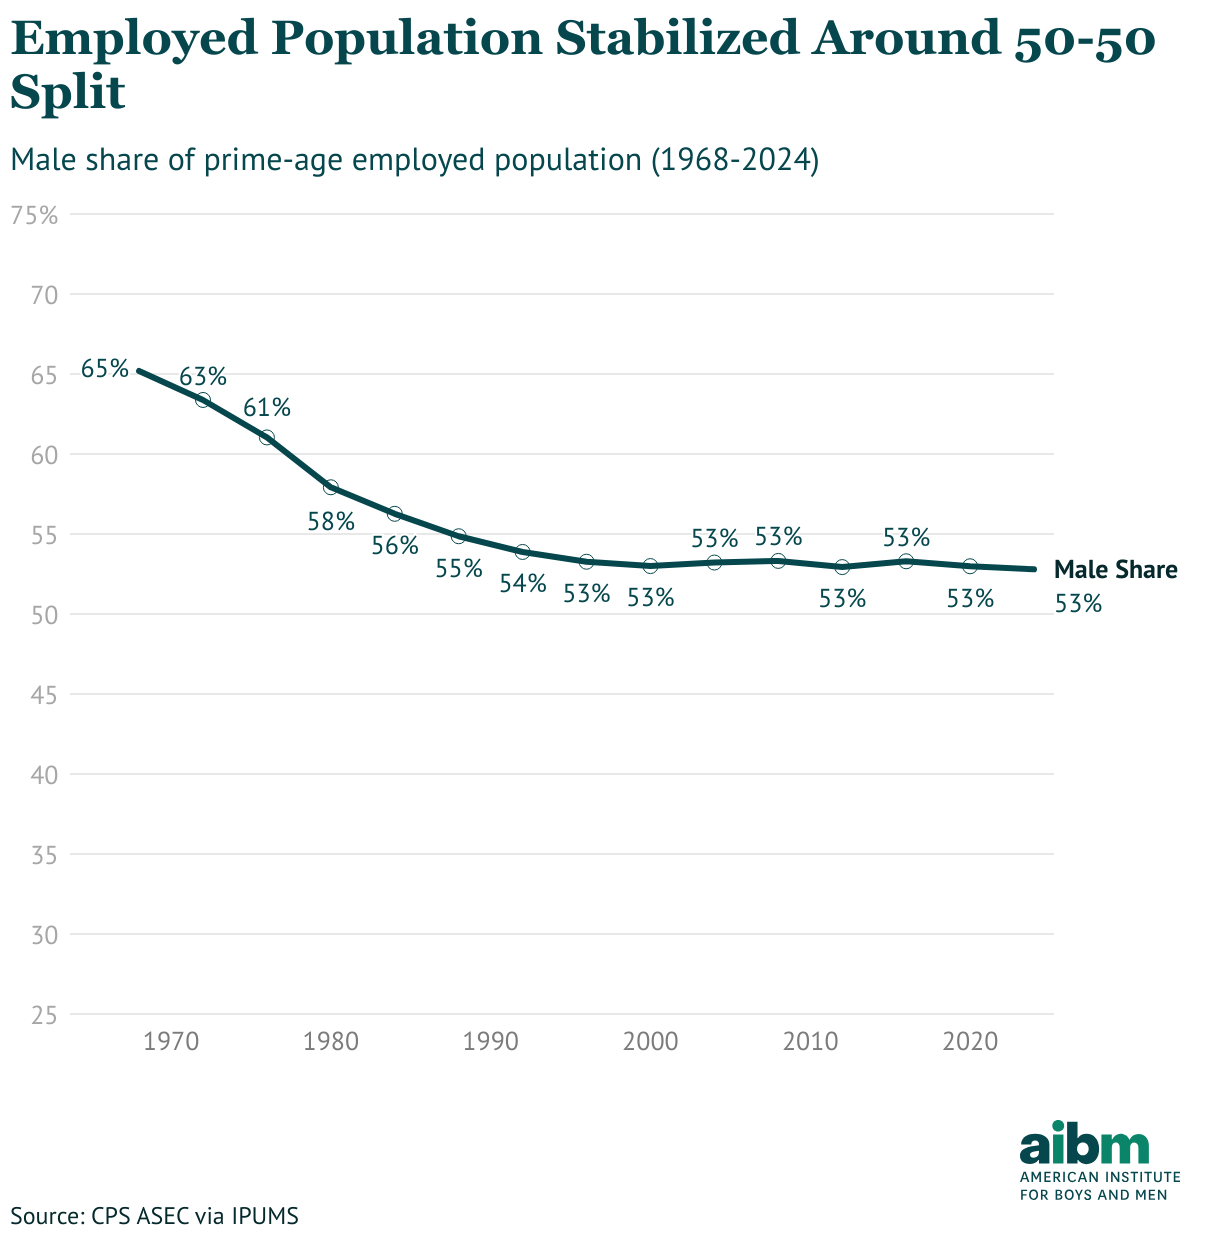
Figure 1
Data noteData used in this brief come from the U.S. Census Current Population Survey’s Annual Social and Economic Supplement (ASEC), via the Integrated Public Use Microdata Series (IPUMS). For harmonized occupational coding, we use the “OCC2010” harmonized occupational variable, created by IPUMS, to look at occupational distributions and gender splits over a fifty-year period. Additionally, we limit our analysis to the following individuals:
- Prime-age (25-54 years-old) men and women
- Men and women who were employed in the week prior to being surveyed
We use both occupational groups (groupings of detailed occupations), and detailed occupations in this analysis. When looking at detailed occupations by state, we analyze the state of residence for each worker.
Alongside the demographic shifts in the overall labor market came changes by occupation. As women entered the workforce, some occupations saw large shifts and others barely changed, as shown in figure 2. Notably, most occupations that shifted have moved toward gender balance.
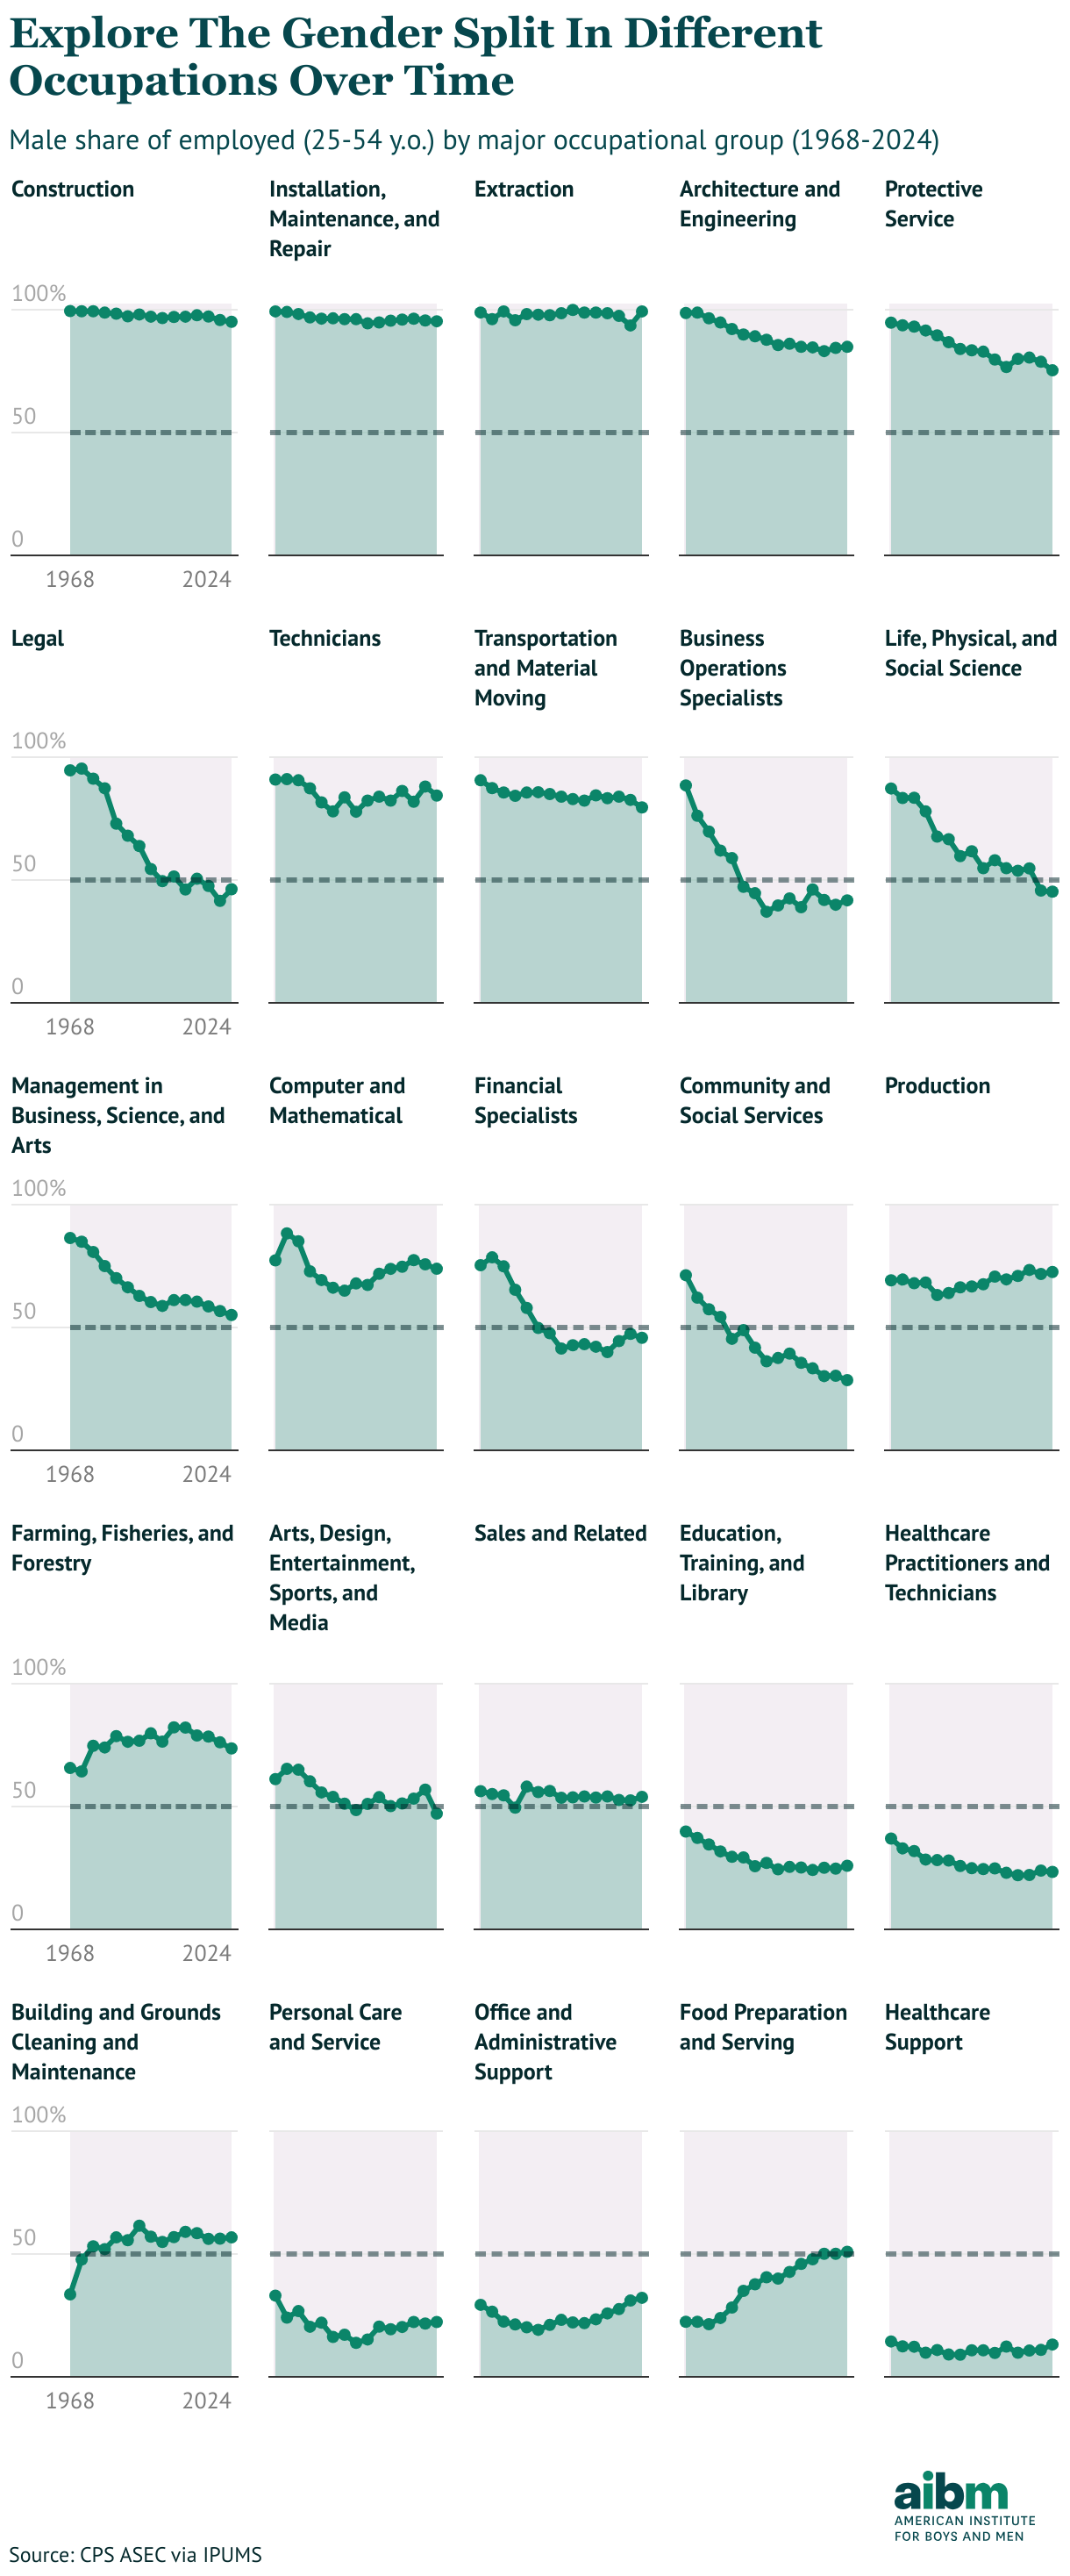
Figure 2
Many occupations that were heavily male became more gender-balanced. “Management in Business, Science and Arts” (including chief executives, financial managers, and public relations managers) went from 87% male in 1968 to 55% male in 2024. “Life, Physical, and Social Science” occupations shifted from 87% male to 45% male. “Legal” occupations moved from 95% male to 45% male.
Some occupations even became more male over time. “Food Preparation and Serving” shifted from 22% male in 1968 to 51% male in 2024. “Computer and Mathematical” was 77% male in 1968, dipped to 65% male in 1992, then rose back to 74% male in 2024 as the tech sector expanded rapidly.
Other occupational groups remained heavily gender-skewed. Construction and repair roles, protective services and technical roles remain overwhelmingly male, while healthcare and teaching not only have few men, but have a declining share of men. The education sector (including training roles and librarians) has dropped from a male share of 40% in 1968 to 26% today; the male share of healthcare practitioners has fallen from 37% to 23% over the same period. (For more on the lack of men in these occupations see our paper “The HEAL Economy”).
Changes in the nature of work
To understand how the nature of work has changed, we now shift from asking “how male or female is this occupation”’ to “what work are men and women actually doing?” This approach reveals that the transformations within each gender exceed the compositional changes between genders — related to economic forces like technological change, manufacturing collapse, and service sector growth.
The most profound shift is the decline of production and rise of other types of work, as shown in figure 3. While the male share of production workers remained relatively stable, the share of men working in production collapsed — from 20% of all male workers in 1968 to just 7% in 2024. Conversely, in 1968, almost no male workers worked in “Computer and Mathematical” occupations; that share now stands at about 7%.
Another notable trend is occupational diversification. In 1968, just three occupational groups — Production, Management, and Transportation — employed over half of male workers. In 2024, it takes six groups to reach 50%.
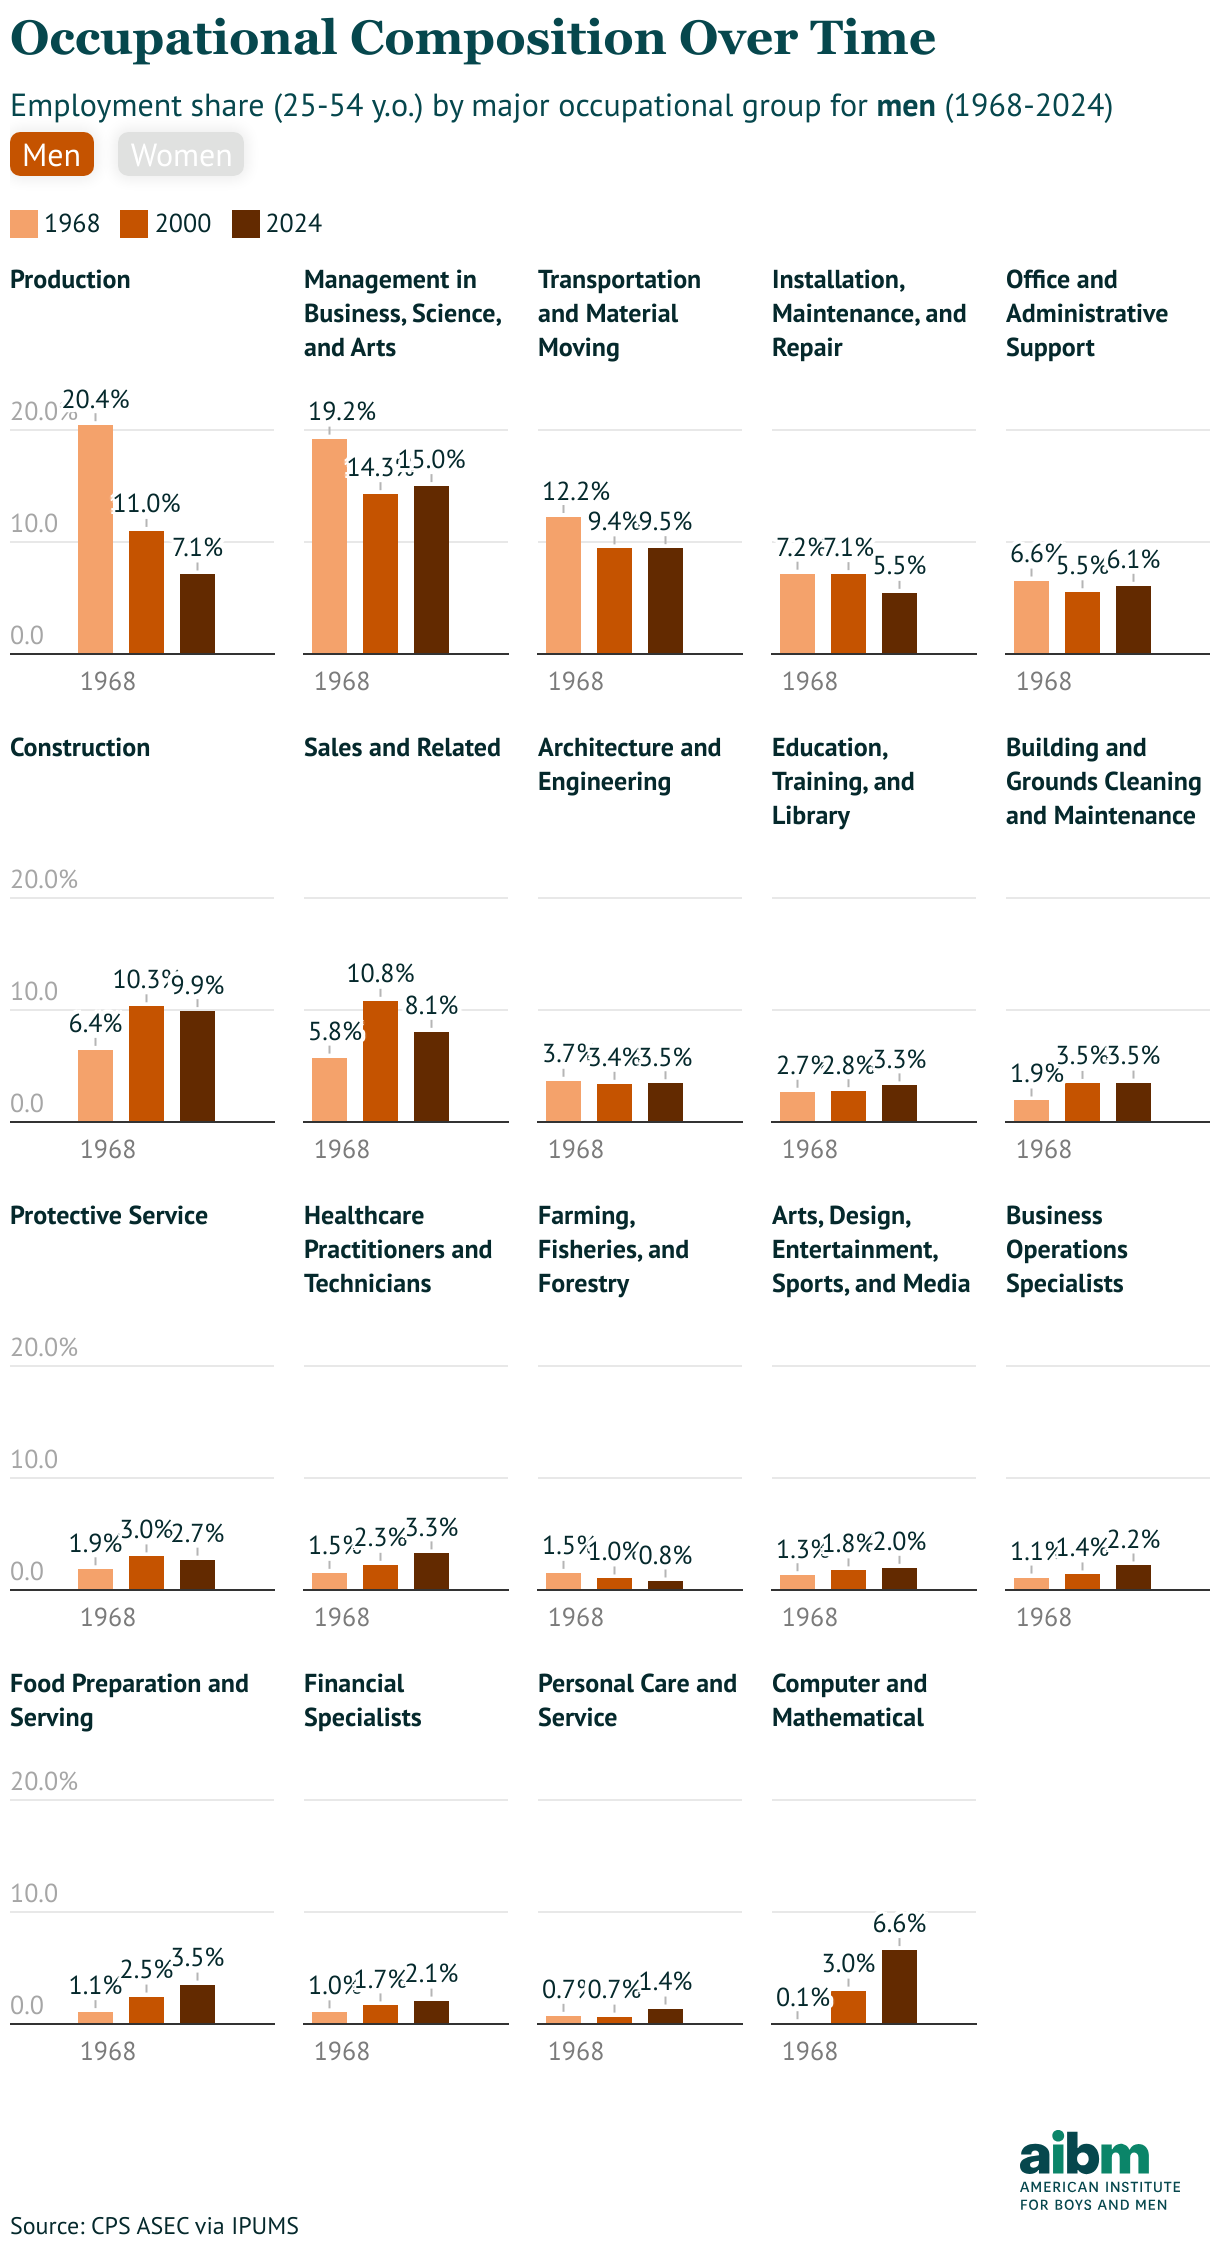
Figure 3
Women experienced a parallel transformation and diversification. In 1968, almost 1-in-3 female workers were employed in “Office and Administrative Support”; in 2024, that share had halved to about 14%. Other occupations shifted dramatically as well:
- “Healthcare Practitioners and Technicians” grew from 5% to 12%.
- “Management in Business, Science, and Arts” expanded from 6% to 14%.
- “Production” declined from 17% to just 3%, following a similar trend as men.
Work across the country
Beyond these national trends, regional economic specialization creates distinct occupational patterns. While management is the most common occupation for men nationally, it varies by state, as shown in figure 4. In Washington, software development is the most common male occupation, comprising about 7% of male workers in 2024. Trucking dominates in several states, including Iowa (6% of all male workers) and Rhode Island (9%).
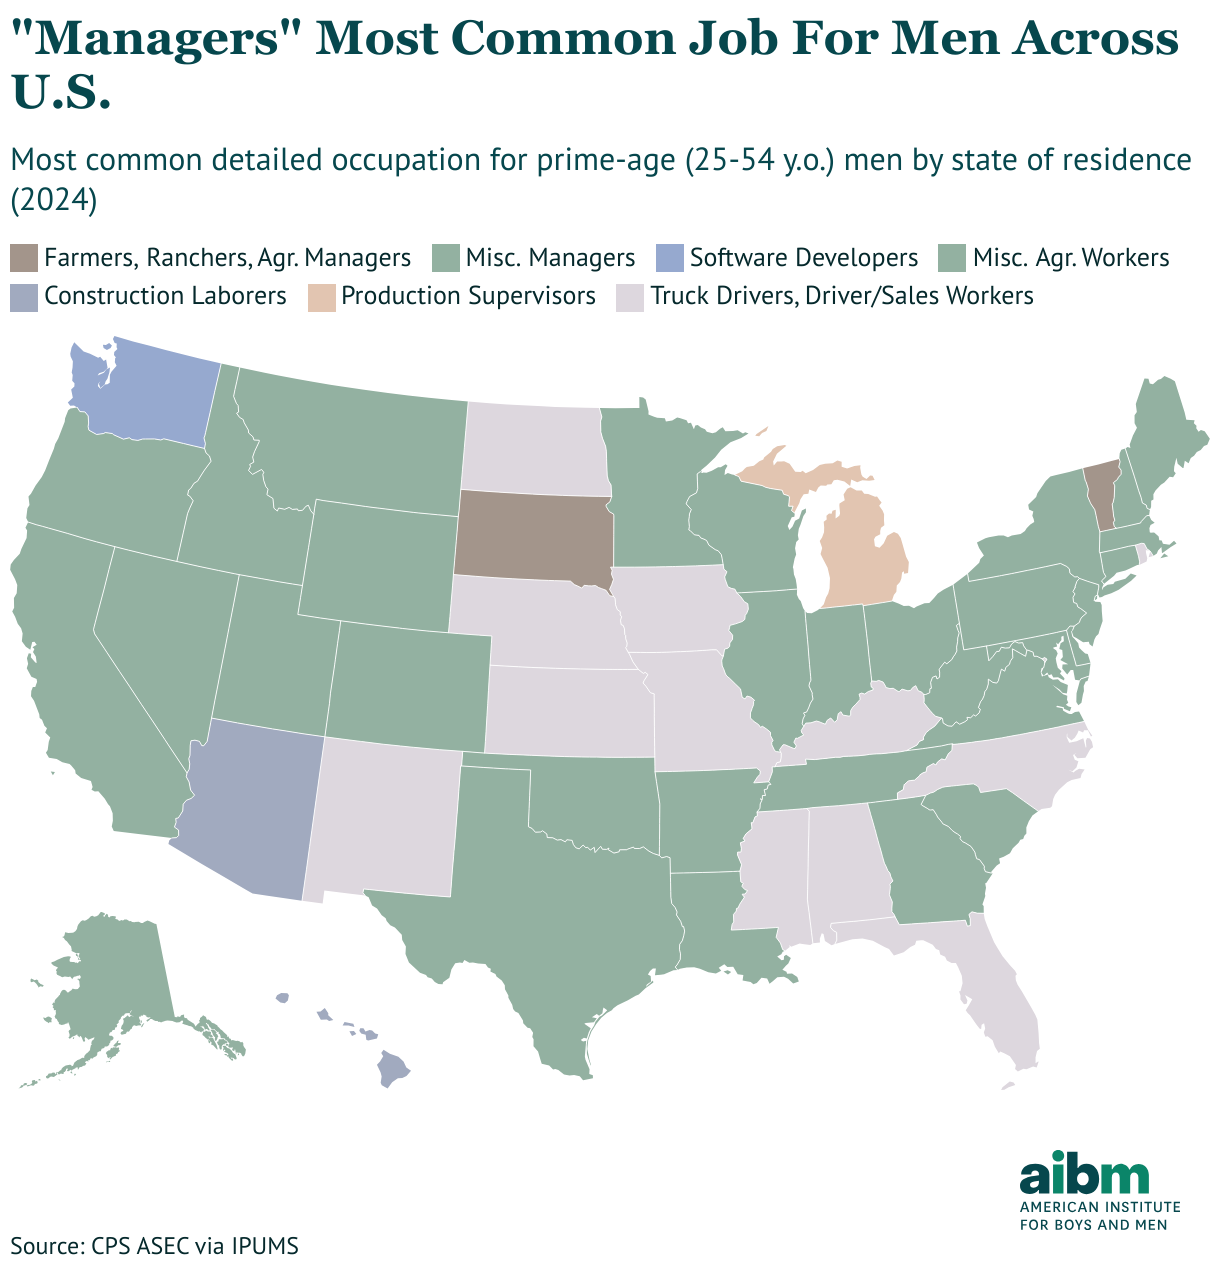
Figure 4
Women show slightly more geographic variation, as shown in figure 5. Nursing is the most common female occupation in the largest number of states — particularly across the upper Midwest, parts of the South, and New England. In both West Virginia and South Dakota, about one-in-ten female workers were registered nurses in 2024. In several states, particularly across the Southwest, teaching is the most common occupation for women. In Texas, about 6% of female workers were elementary and middle school teachers; in Connecticut, about 7%
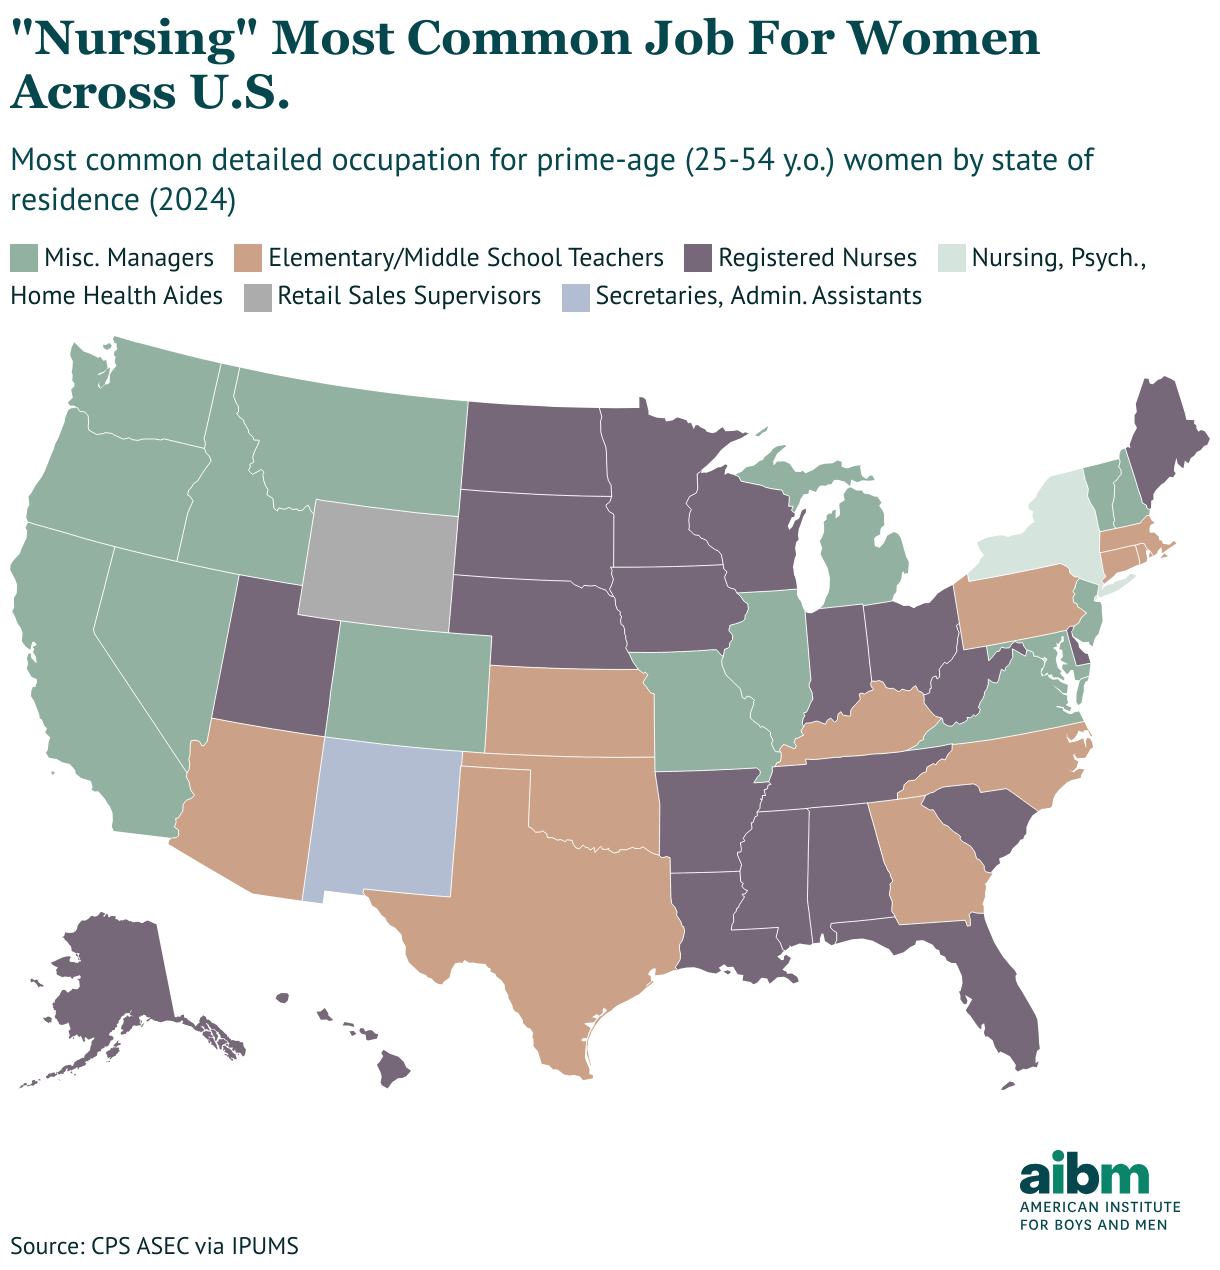
Figure 5
Future of work in America
As shown in this analysis, the nature of work has considerably changed over the past 50 years, for both men and women. Of note are a number of key trends:
- The entry of women into the workforce and a near-gender-parity in the economy, where most occupational groups have increased their female shares over time, though not uniformly
- The significant relative decline in manufacturing and production employment for both men and women
- The relative rise of HEAL and STEM employment for women and men, respectively
- The general occupational diversification of the U.S. economy
Notably, discussions of occupational gender-imbalance rarely acknowledge where men are largely absent — education, nursing, social work, and mental health. These are large, growing sectors of the economy, yet male underrepresentation attracts far less attention than debates about women’s presence in sectors like STEM. Understanding why men are missing from these professions is important for researchers and policymakers alike.
The future of employment is difficult to predict, but understanding which occupations are growing and declining, and how men and women experience these transitions differently, can help policymakers develop more effective support for American workers.
Subscribe to our newsletter
Get the latest developments on the trends and issues facing boys and men.
Related Research

Employment
Data Spotlight: Men are losing out on healthcare jobs. Is it time for action?
Healthcare job growth is reshaping the workforce. What it means for men’s career paths and future opportunities.

Employment
Data Spotlight: Gender gaps across life
U.S. gender gaps across life: men lag in education, health & incarceration; lead in earnings & employment. See the age-by-age data.

Employment
How NEETs spend their time
How young people not in work or school spend their days—and why NEET men’s leisure time and isolation matter for norms, policy, and work.