ResearchEducation & Skills, Fatherhood & Family
A generation of lost men? The reality of NEET data

Summary
This research brief explores the characteristics and trends of young people who are classified as NEET—not in education, employment, or training. The authors explore how parenthood, disability, race, and geography shape NEET status differently across genders.
Key takeaways
- In 2024, about 12% of men and 13% of women aged 16-24 were classified as NEETs, not in school, employment, or training. The NEET rate for young women has notably declined over the past 30 years, while the rate for young men has slightly increased.
- NEET rates vary across subgroups. For example, young mothers are four times as likely to be considered NEETs than women without kids, and young men with disabilities are about three times as likely to be NEETs than men without disabilities.
- One in five NEET women (20%) are caring for children, compared to 3% of NEET men.
- There is an increasing share of young men not in school or the labor force, from 4% in 1990 to 8% in 2024.
- There is variation across the nation too: Alaska has the highest male NEET rate (20%), while Minnesota has the lowest (7%).
Young men today are less likely to work than in previous decades, and male college enrollment has stagnated, fueling narratives of a generation increasingly adrift. A group of key concerns is the population labeled NEET—young people “not in education, employment, or training,” also known as “disconnected youth” or “opportunity youth.” To effectively address the challenges facing young men in the United States today, it is essential to clearly understand the characteristics of the NEET population, including adding nuance to commonly used definitions.
We define NEETs as the noninstitutionalized civilian population aged 16–24 who were neither employed nor enrolled in school (high school or college). Importantly, individuals classified as NEET may still be actively seeking employment. To assess true disconnection, we disaggregate this group by their primary reasons for being NEET—including if they are actively looking for work, have a disability, and their parental responsibilities.
Who are the NEETs?
In 2024, the NEET rates for men and women were both around 12%. (Other estimates of the U.S. NEET rates range from 11% to 15%, depending on data source and population specifications.) Recent trends have been very different, however.
NEET rates among young women today have declined sharply, from 19% in 1990 to 13% in 2024, as figure 1 shows. This decline mirrors the significant rise in female college enrollment as well as the fall in teen pregnancies.
The NEET rate among young men has risen slightly, from 10% in 1990 to 12% in 2024. Male NEET rates appear more sensitive to economic cycles, rising notably during downturns such as the Great Recession and the COVID-19 pandemic.

Figure 1
DATA NOTEData used to estimate NEET rates come from the U.S. Census Monthly Current Population Survey (CPS), via the Integrated Public Use Microdata Series (IPUMS). Survey respondents for this analysis are limited to the noninstitutionalized (not incarcerated or in armed forces) population, aged 16-24 years-old. NEETs are calculated as individuals who are both not employed and not enrolled in school (high school or college) in the week before being surveyed.
Respondents surveyed in the summer months (June, July, and August) are removed from the analysis, due to two main reasons. First, given how the school attendance variable is coded, there is a significant drop in school attendance in these months; this is because respondents not taking summer classes during their break are told to answer “no” to whether they’re at school. Second, given that most students take summer jobs on their break, the employment rate for the 16-24 year-old population is notably higher in the summer than in other months. These two counteracting effects lead us to remove these months from the analysis.
When estimates are calculated based on “disability” status, this status is classified based on whether the respondent responds affirmative to whether they have any of the following cognitive and physical difficulties: difficulty with hearing, vision, remembering, walking or climbing stairs, mobility outside the home, or personal care. IPUMS highlights that the CPS finds lower estimates of disability prevalence than other datasets.
There are many reasons why young people might not be working or enrolled in school, and these reasons may vary by gender. Building on an analysis by the Center for Economic Policy Research, we break down the NEET population by those who are:
- Parents
- Disabled
- Actively looking for work
- None of the above
Figure 2 shows the composition of the NEET population by these categories. The majority of NEETs do not have a disability or children, and they are not actively seeking employment. But male and female NEETs differ in that:
- Almost one-in-three male NEETs are seeking work, compared to about one-in-five female NEETs.
- Almost 17% of male NEETs have a disability, compared to about 11% of female NEETs.
- Almost 20% of female NEETs have kids, compared to only about 3% of male NEETs.

Figure 2
Looking at male NEETs by labor force status reveals an interesting time trend: male NEETs are now less likely to be seeking work, as shown in figure 3. From 1990 to 2024, the share of NEET men who are unemployed, but still seeking work, has declined (6% to 4%), while the share who are out of the labor force altogether has increased significantly (4% to 8%).
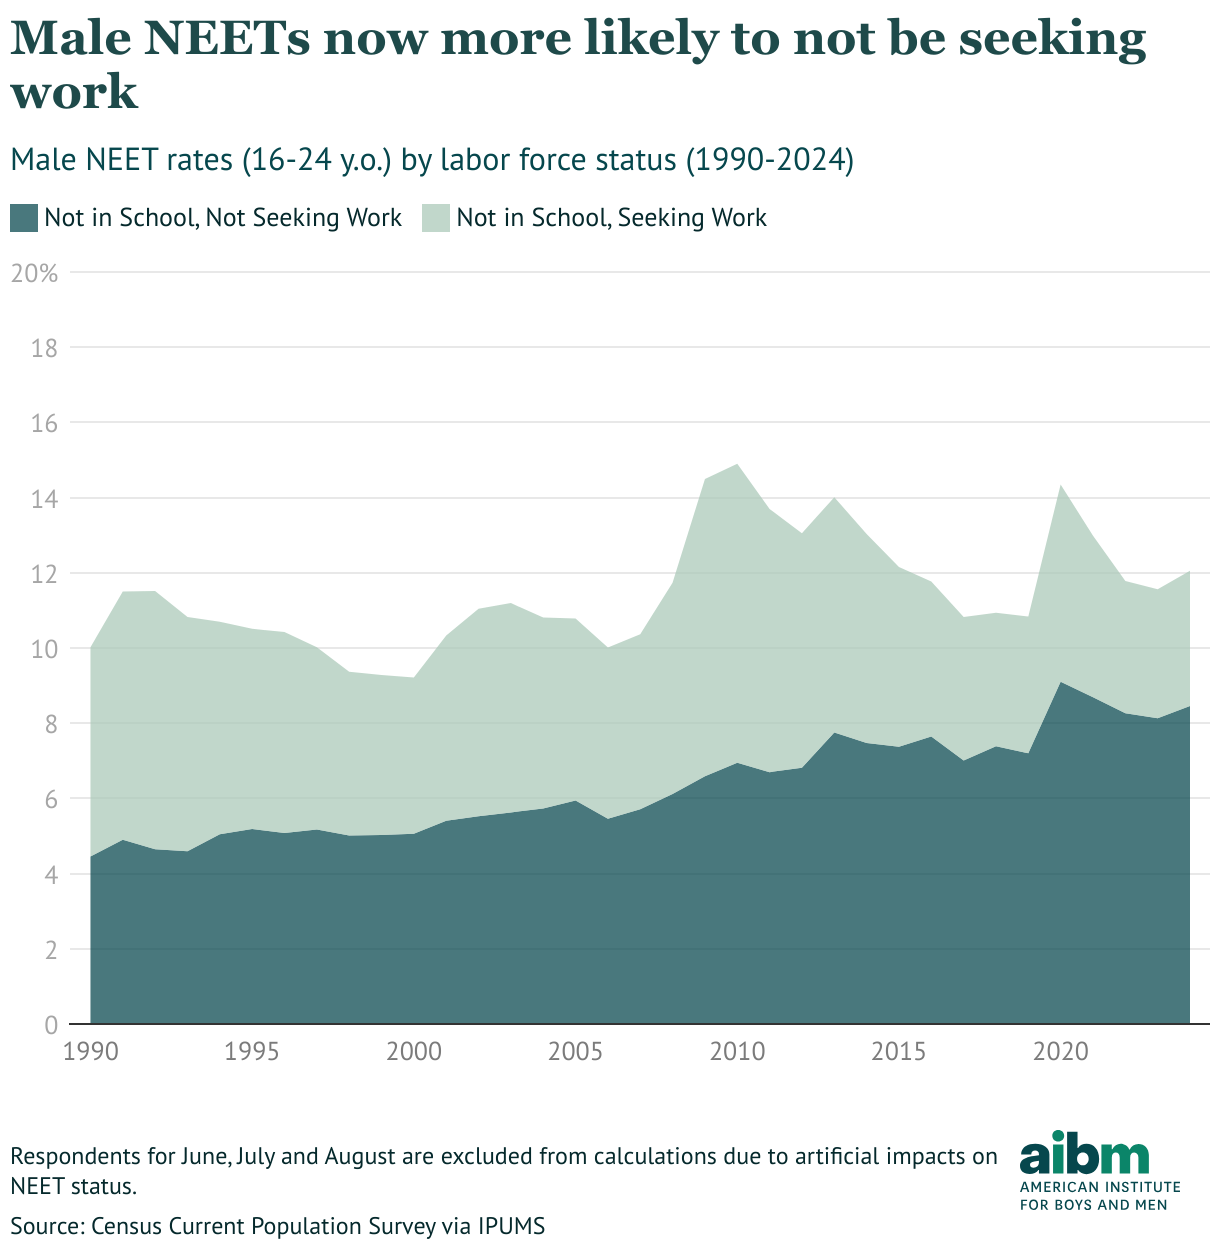
Figure 3
Put differently, 40% of male NEETs in 1990 were not seeking work; by 2000, this share had increased to about 50%, and by 2024, two-in-three male NEETs were not seeking work.
Meanwhile for women, parenthood in particular strongly predicts NEET status, as shown in figure 4.

Figure 4
Young mothers are nearly four times more likely to be NEET than women without children (40% vs. 10%), while fatherhood makes little difference for young men (15% vs. 12%). In other words, parenthood appears to have a big effect on education and employment for young mothers, but not for young fathers.
Disability is another important predictor of NEET status. Young men and women with cognitive or physical difficulties are about three times more likely to be NEET than those without a disability, as shown in figure 5. About 35% of young men with a disability are NEETs, compared to just 11% of men without a disability; the shares are similar for women (31% and 12%).
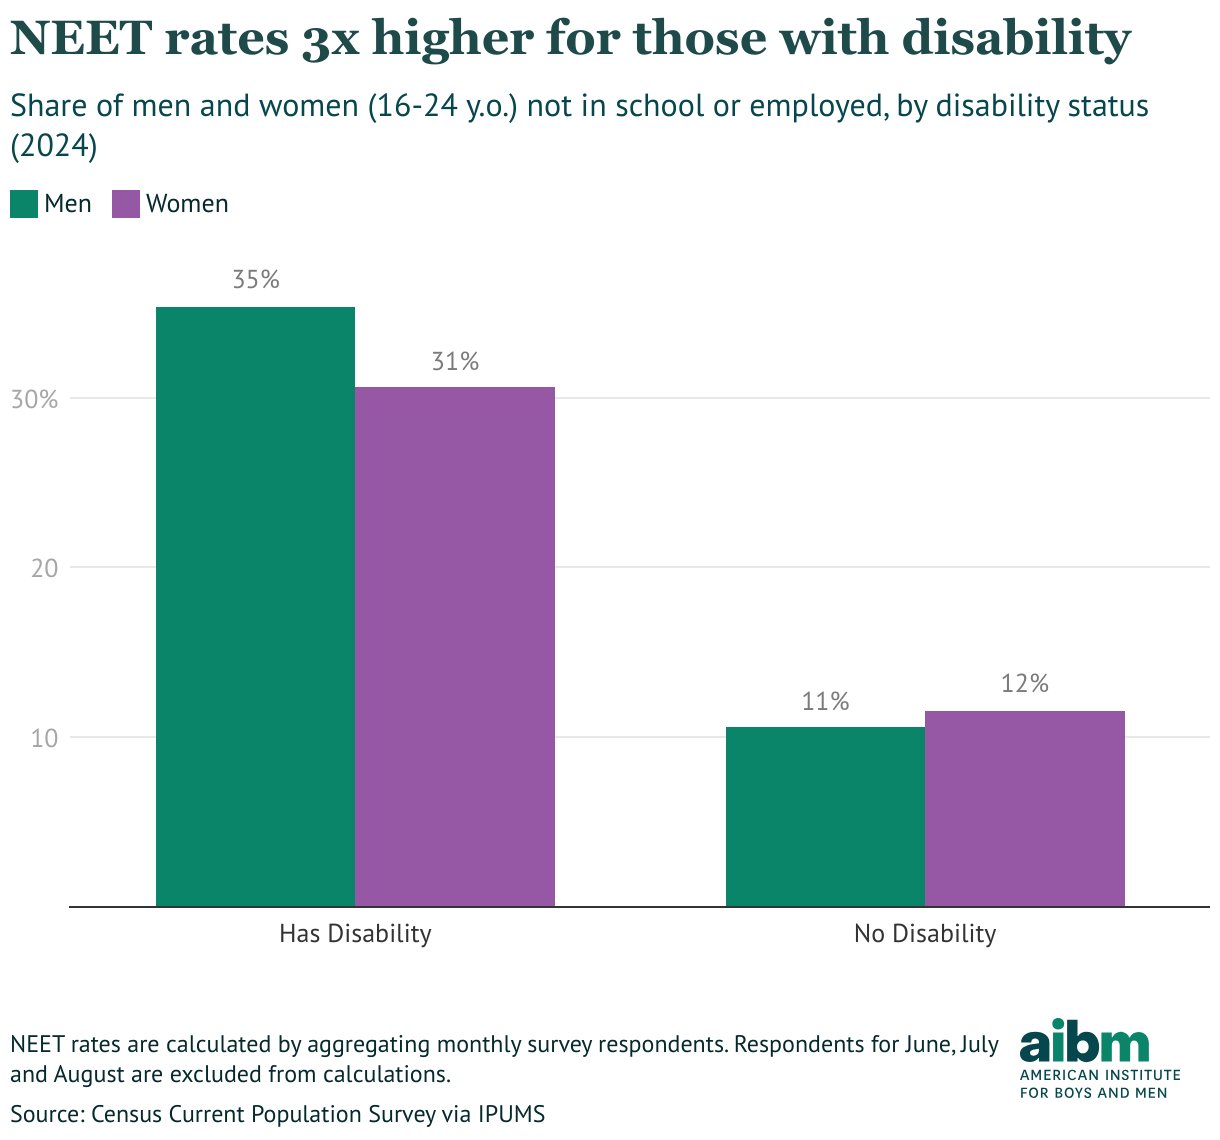
Figure 5
It’s important to remember that the majority of NEET men and women (80% and 69% respectively) are without kids or disabilities. Therefore, we should highlight NEET rates for this group separately: in 2024, about 10% of young men and women aged 16–24 without disabilities or children were NEETs. Furthermore, when defining NEETs as those not in school and not seeking work, rates for men and women without kids or disabilities fall further to about 7%.
NEETs by demographics
NEET rates also vary by race, as seen in figure 6. Rates are slightly higher for young women than men across races, except for Black men and women: about 18% of young Black men are NEETs, compared to 15% of young Black women. Asian men have the lowest NEET rates at 8%, slightly lower than Asian women at 9%.
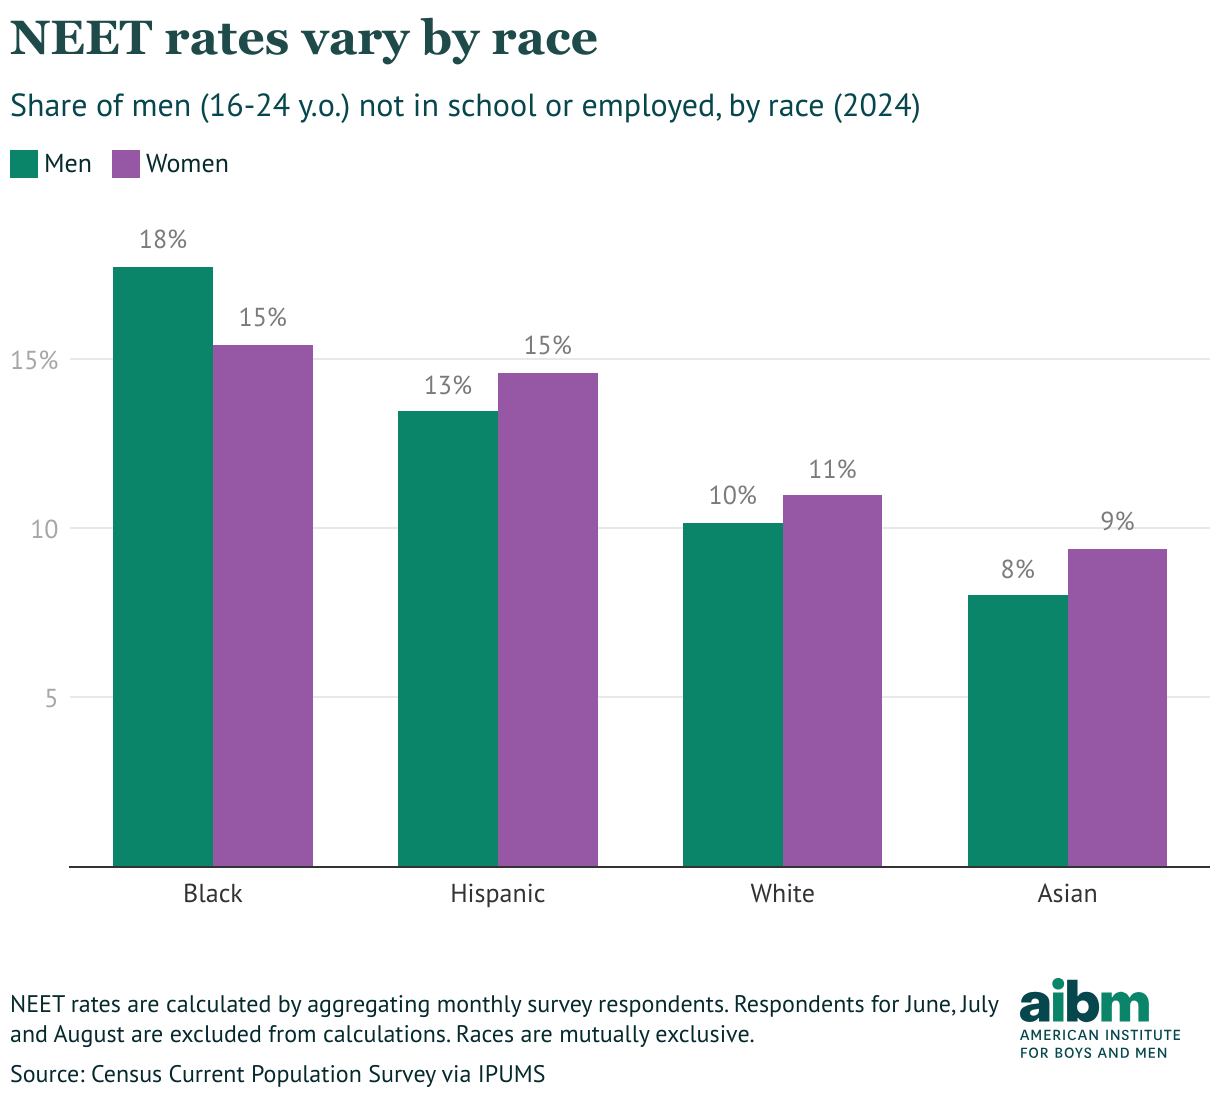
Figure 6
NEET rates have declined for women across race, with general stability for men. For example, in 1990, about 31% and 29% of Black and Hispanic women were considered NEETs, respectively; in 2024, about 15% of both were NEETs.
There is also significant variation in NEET rates by geography, as shown in figure 7. Alaska has the highest male NEET rate at 20%, while Oklahoma has the highest female NEET rate at 18%. Minnesota has the lowest male rate at about 7%, while Wisconsin has the lowest female rate at about 6%.
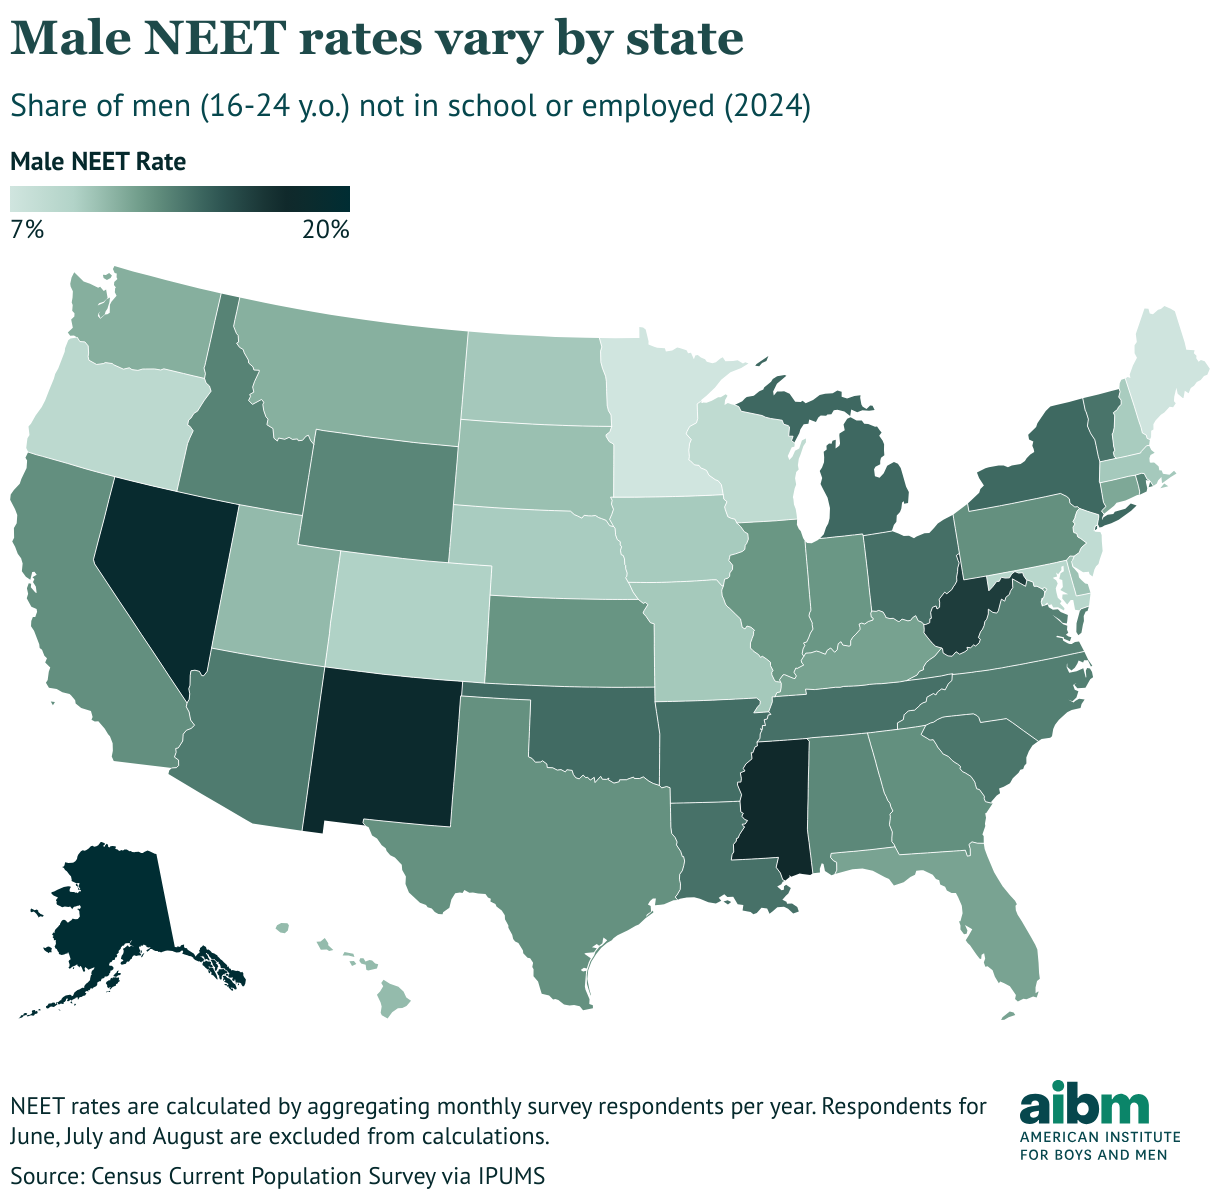
Figure 7
In 25 states and Washington D.C., young men have lower NEET rates than young women. The largest gaps in both directions are in Nevada, with 19% and 10% of young men and women being NEETs, and in Missouri, where 10% and 17% of young men and women are considered NEETs.
Conclusion
About one in ten young men are disconnected from employment and education. Most of this group are not seeking work, and very few are caring for children.
This is a group to which policymakers are rightly paying attention. This is an important life stage for setting young men and women up for success. But it is also important to keep these numbers in perspective. The large majority of young men are still earning or learning (or both). We can care about the minority without stereotyping a whole generation.
Subscribe to our newsletter
Get the latest developments on the trends and issues facing boys and men.
Found our publication insightful?AIBM encourages the sharing of our publications with proper acknowledgment. Reprints do not require permission, but please follow our syndication guidelines.
Related Research

Education & Skills, Fatherhood & Family
Will more recess help boys in school?
Does recess help boys in school? A research summary on behavior, focus, learning outcomes, and what the evidence shows.

Education & Skills, Fatherhood & Family
Data Spotlight: Gender gaps across life
U.S. gender gaps across life: men lag in education, health & incarceration; lead in earnings & employment. See the age-by-age data.

Education & Skills, Fatherhood & Family
“School’s not cool”: How peer pressure can hurt boys’ education
Peer pressure and masculine norms discourage boys—especially disadvantaged ones—from visible academic effort, widening education gaps.