ResearchEducation & Skills
Major changes: Gender shifts in undergraduate studies over time

Summary
Over the past fifty years, higher education has gone through a dramatic transformation: women now significantly outpace men in college attendance and bachelor’s degree completion. As a result, men’s share of degrees has declined sharply across nearly all fields. Yet, beneath this broad demographic shift, there is remarkable stability in the gendered nature of college major choice.
Men continue to be the majority of degree earners in engineering and computer science, while women consistently gravitate toward psychology, education, and health fields. While the “male fields” have become somewhat less male, the “female fields” have all become more female. A few majors, like the social sciences and business, have moved toward greater gender balance, reflecting their broad and growing appeal. Understanding the persistence of gender differences in majors provides important context for trends in enrollment, retention, and future workforce composition.
Key takeaways
- The gender divide in college majors is stark and clear. For example, men make up only 27% of bachelor’s degree earners in English, but 77% in computer science.
- The share of men has declined across most majors: for example 56% of psychology degrees went to men in 1971, compared to 20% in 2022. This decline largely reflects women’s overall increase in college attendance, rather than dramatic shifts in men’s underlying preferences.
- Some subjects, notably the humanities, have seen absolute declines in degrees awarded. For instance, fewer men earned English degrees in 2022 than in 1971.
- While gendered preferences have remained relatively stable, some majors have gained popularity over time. For example, computer science now makes up 10% of male degree earners, compared to 5% in 2000 and less than 1% in 1971.
Women have accounted for the majority of bachelor’s degree earners since 1982, and the gap has slowly been growing since then. But the gender story varies by major.
Majors are more than just academic choices; they shape students’ interest and experiences in college, career trajectories, and earning potential. Understanding which subjects men and women choose, how these choices have evolved, and why gender patterns persist can help us identify barriers contributing to lower enrollment and retention among men.
Women now account for 58% of undergraduate enrollment, so it’s unsurprising that most college majors are predominantly female, as illustrated in figure 1. Yet, notable gender imbalances persist. STEM fields remain distinctly male-dominated: in 2022, men earned 77% of computer science degrees, 76% of engineering degrees, and 59% of mathematics and statistics degrees. Biology, however, stands out as a notable exception, with men earning only 34% of degrees in the field. And women received the vast majority of degrees in health, social services, and education.
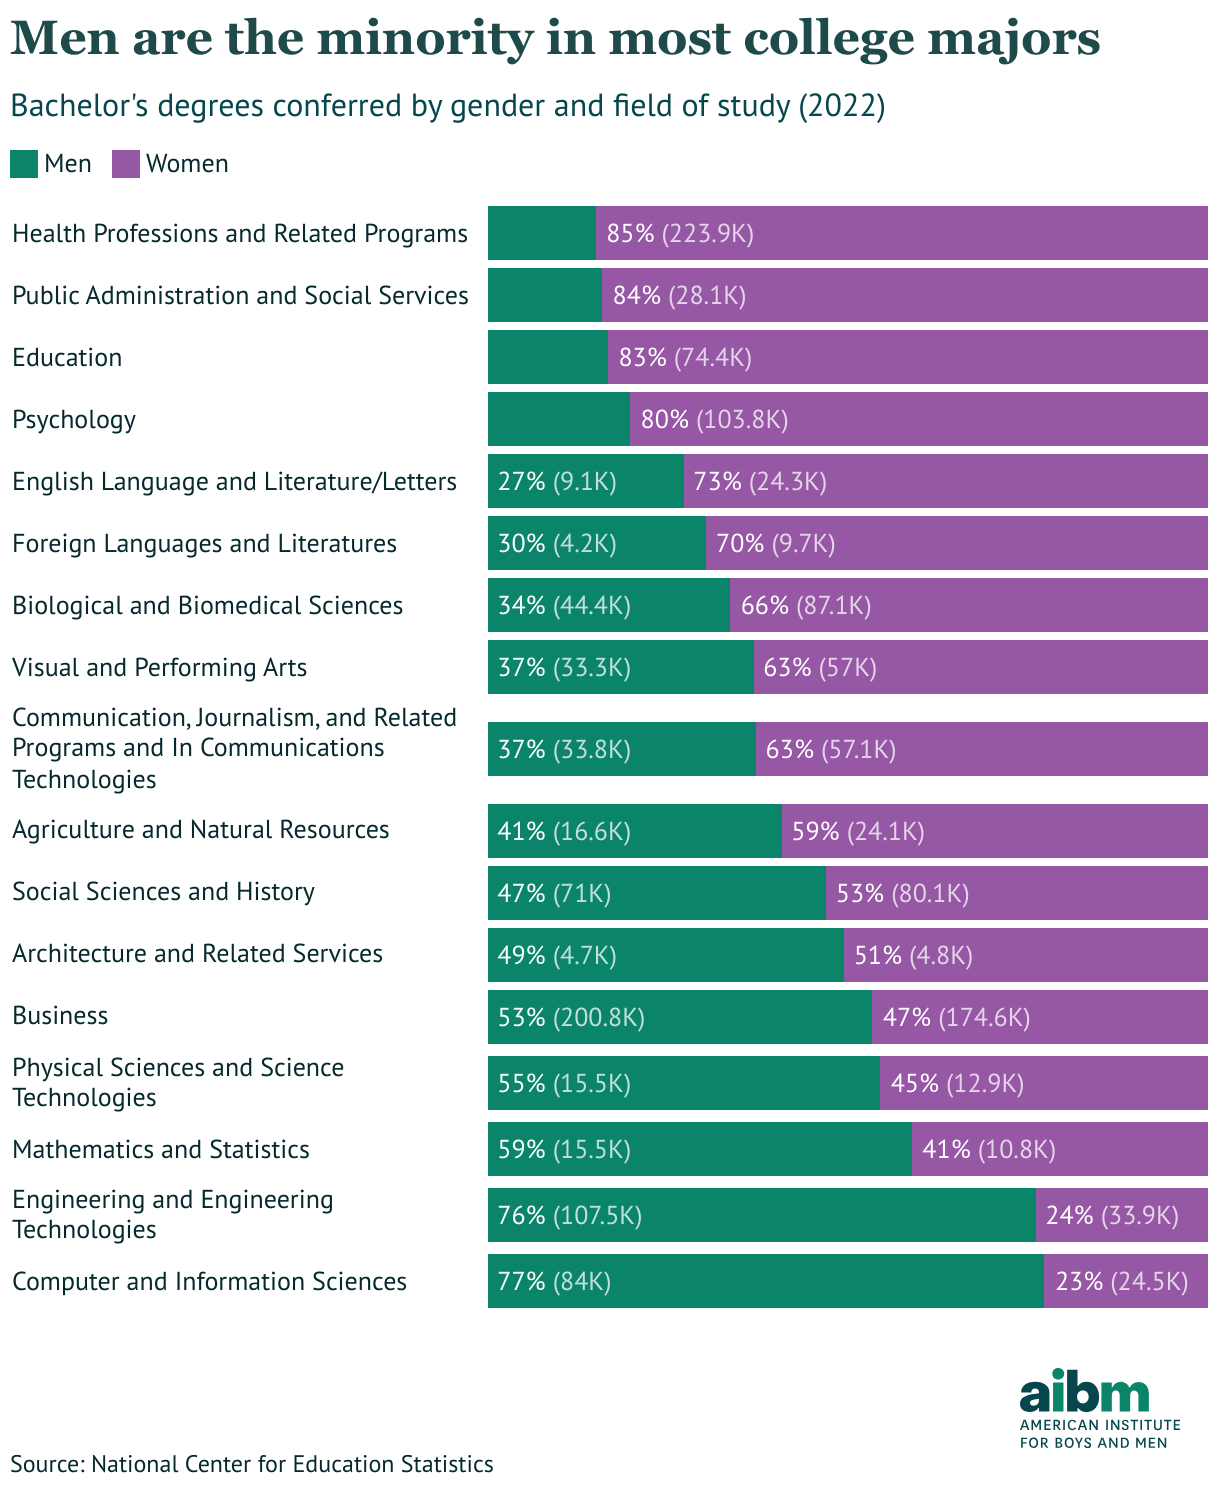
Figure 1
The data used in this brief is from the National Center for Education Statistics (NCES), which collects data on a host of educational variables from individual colleges, including—but not limited to—enrollment, retention and graduation. Data from 1952 to 2018 is taken from the 2019 Digest of Education Statistics tables; we then merge the following four years from each subsequent annual table to obtain the full set. In total, 17 subjects are tracked over the past 50 years, representing at least 80% of all bachelor’s degrees conferred per year.
When referring to an individual year, a single year is meant to represent an academic year, with the measurement being the number of bachelor’s degrees conferred in a given academic year. For example, the year 1980 represents the 1979-1980 academic year, and the year 2022 represents the 2021-2022 academic year.
Majors over time
When we look historically at how majors have evolved, clear patterns emerge that help explain the current landscape. Figure 2 shows the male share of bachelor’s degrees conferred over time, as well as the absolute changes in degrees conferred for both men and women. There are fields that are:
- Consistently majority-male: namely computer science, engineering, and math and statistics. Even as female enrollment has outpaced male enrollment substantially, more men than women continue to go into these fields.
- Consistently majority-female: subjects like the health professions and psychology have always drawn more women and have become increasingly female as women’s overall enrollment has grown.
- Shifting in gender balance: biology, physical sciences, business, and the social sciences have experienced substantial shifts. Biology, for example, moved dramatically from 71% male in 1971 to just 34% male in 2022.
- Declining overall: majors in the humanities and education have experienced declining enrollment, both in relative popularity and absolute numbers, highlighting broader shifts in student interests and career preferences.
These patterns are largely the result of two things:
- Women have been entering college at higher rates than men, which is why we see a generally uniform increase in the share of women earning degrees in all subjects.
- Differences in the fields men and women pursue.
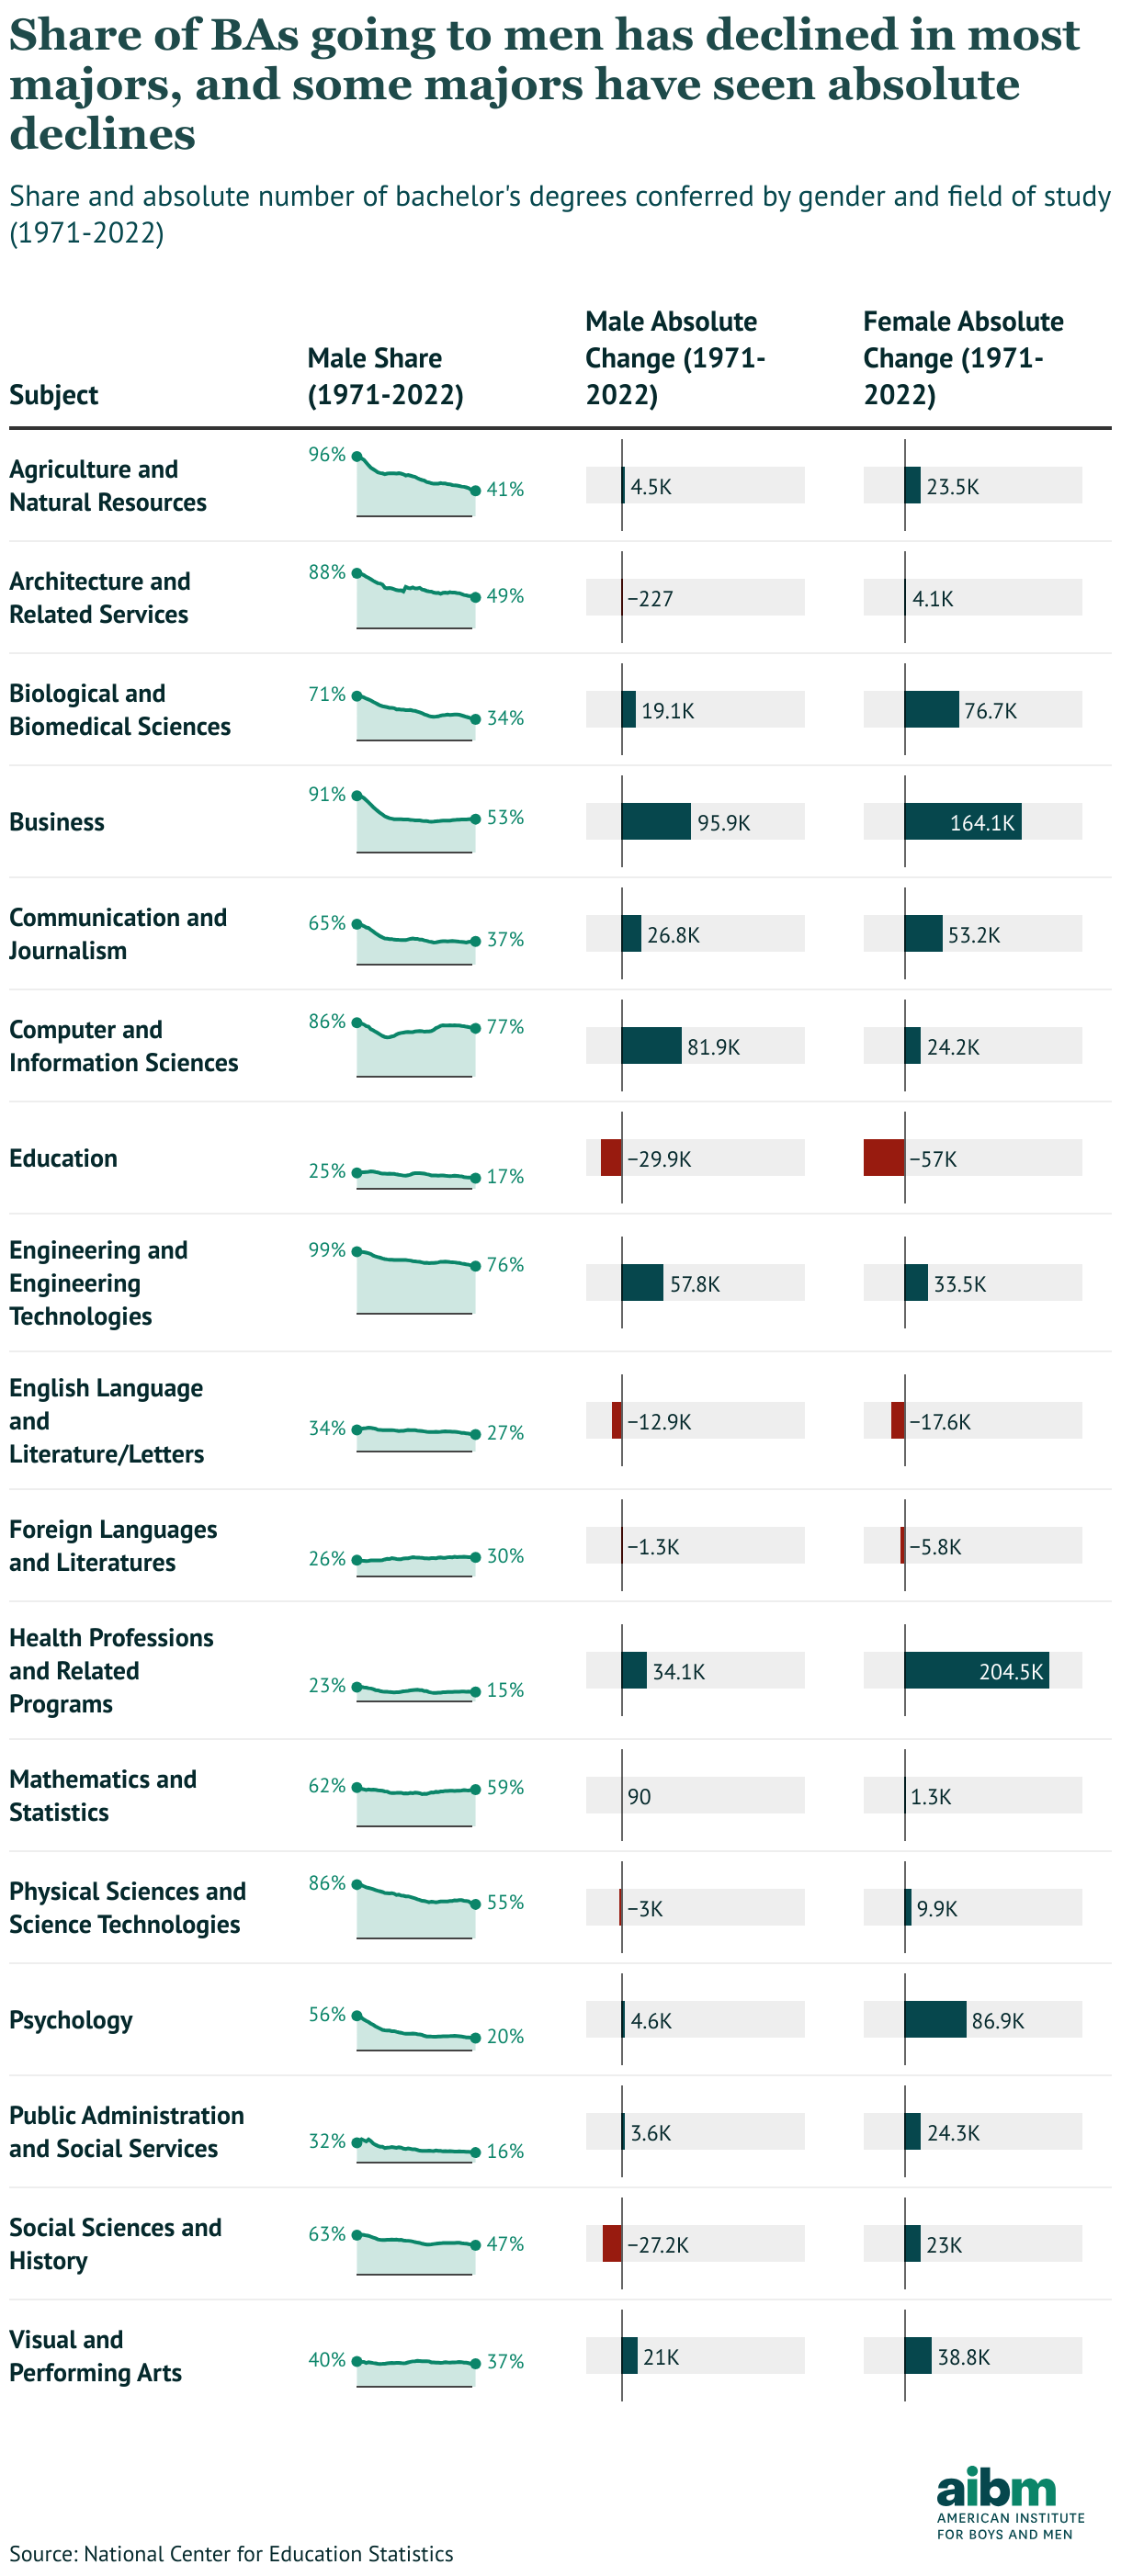
Figure 2
Some majors have actually seen a decrease in the number of bachelor’s degrees in their subjects. For instance, bachelor’s degrees in English have decreased in count for both men and women from 1971 to 2022, shown in figure 2. There were 59% fewer men and 42% fewer women getting a bachelor’s degree in English in 2022 than there were in 1971.
The number of men and women getting degrees in education has also declined over this period. As for trends unique to men, the number of men getting degrees in the social sciences and history, and the physical sciences has declined by 28% and 16% respectively since 1971.
General stability in major selection
Looking at the decline in male share of certain degrees can help explain the decline in male teachers or psychologists. However, to truly understand shifts in preferences, we also need to look at how interests have changed within gender. Looking at changes in majors within gender reveals both broader shifts and stability in academic and career interests for both men and women.
As shown in figure 3, business has remained the most popular major among men over the past 50 years. In 1971, 22% of male bachelor’s degrees were in business, with a slight rise to 24% in 2022. A number of subjects have seen a rise in popularity among men. Of note:
- Computer science, from less than 1% of all male bachelor’s degrees in 1971, to 5% in 2000, to 10% in 2022.
- Engineering, from 10% in 1971, to its peak of 17% in 1984, then down to 13% in 2022.
- Health, from 1% in 1971 to 5% in 2022.
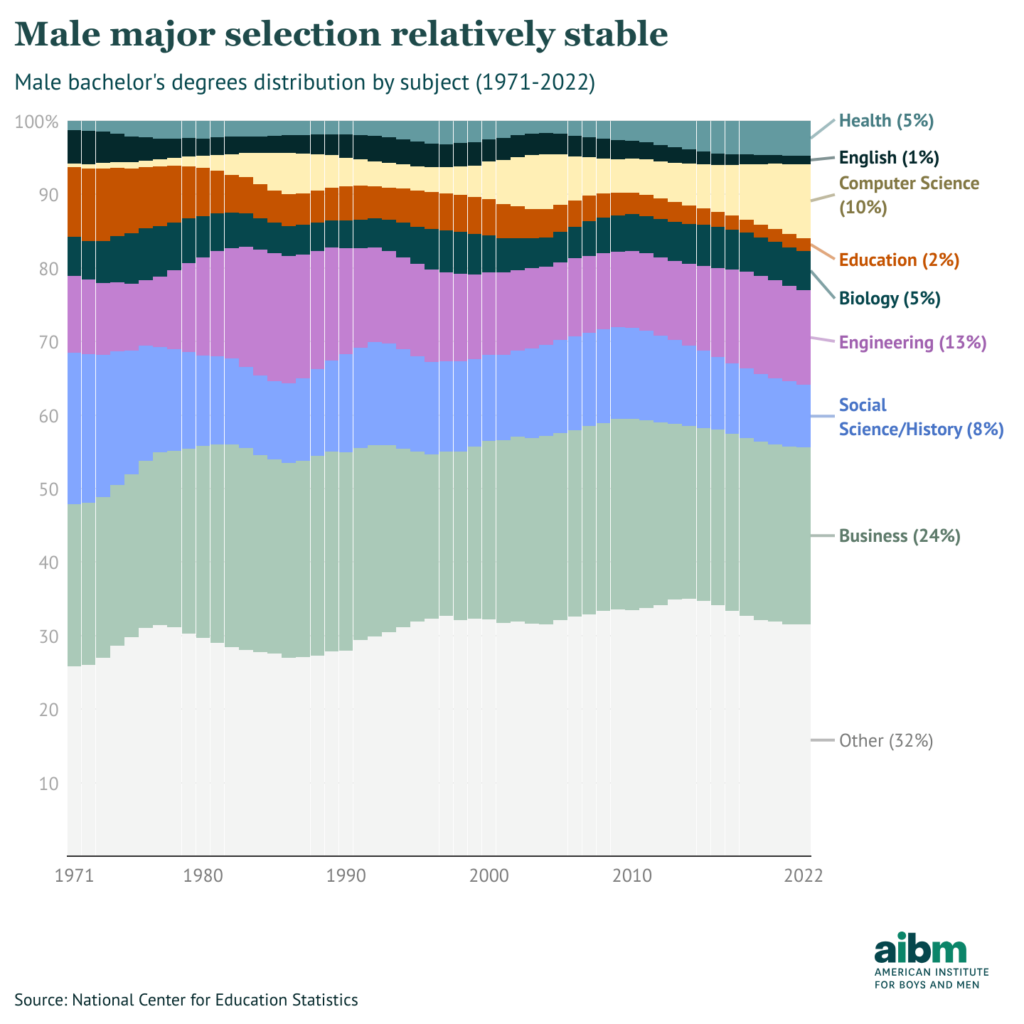
Figure 3 | Download the figure.
On the other hand, some majors have seen a decline in popularity among men:
- Education went from 9% of all male bachelor’s degrees in 1971 to 2% in 2022.
- Social Sciences and history went from 21% to 8% over the same time period.
- English went from 5% of all male bachelor’s degrees to just 1% of them over the same time period.
The picture for women has been a bit more variable, as shown in figure 4. As with men, business is quite popular with women. The key distinction is with health: almost one in five bachelor’s degrees conferred to women are in health. Of the notable majors that have increased in popularity with women:
- As noted, health went from being 5% of all female bachelor’s degrees in 1971 to 19% in 2022.
- Business went from 3% in 1971 to 15% in 2022.
- Biology went from 3% in 1971 to 7% in 2022. Note from before that biology and biomedical science are male-minority STEM subjects.
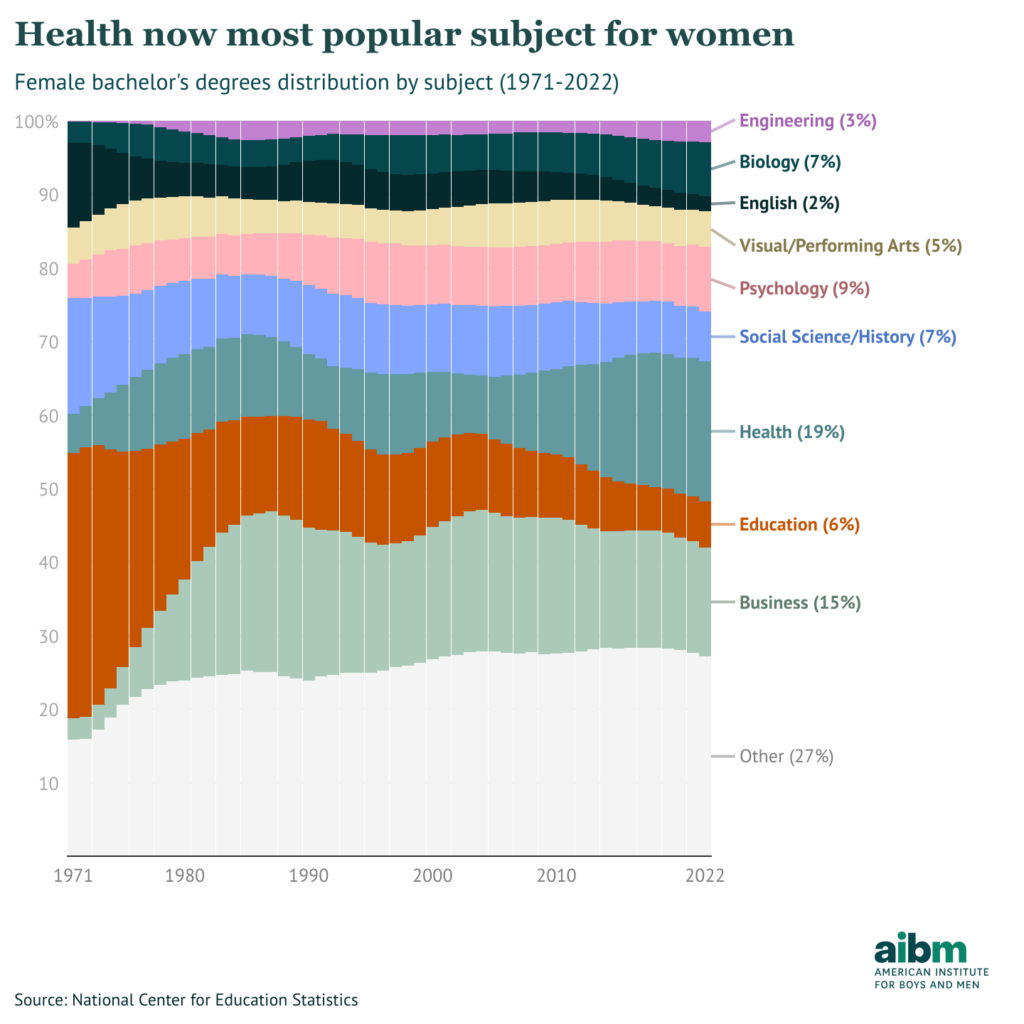
Figure 4 | Download the figure.
The subjects that have fallen out of favor among women are similar to those among men: education, the social sciences and history, and English all have declining shares of female degrees conferred over time. The decline in the share of female degrees in education is particularly striking. In 1971, more than one in three bachelor’s degrees (36%) awarded to women were in education. That number was about one in sixteen in 2022.
Implications and future research
While the data clearly reveals both persistent gender divisions and significant shifts across undergraduate majors, understanding why these patterns exist is complex. Some explanations include:
- Differences in values, priorities, and interests: Men and women often have different priorities when selecting majors. Men typically emphasize future earnings and the social status of their profession, driving them toward STEM and business, while women often prioritize enjoyment of work and gaining approval of others.
- Influence of norms, self-perception, and role-modeling: Work has been done to better understand the role of norms on women’s involvement in STEM, but there is a limited understanding of these interactions for men in female-dominated subjects.
- Differences in academic pathways: Research indicates men are more likely to drop out of college, whereas women are more likely to switch majors. This gendered difference in response can affect the eventual distribution of majors completed by men and women.
However, this analysis—centered primarily on degree conferral—leaves some important questions unanswered. Future research would benefit from addressing questions like the different pathways to major selection, switching and retention for men and women, and the role of capped majors on student enrollment by gender. As the higher education landscape changes, it is important to improve our understanding of these trends in major choice for both men and women.
Subscribe to our newsletter
Get the latest developments on the trends and issues facing boys and men.
Found our publication insightful?AIBM encourages the sharing of our publications with proper acknowledgment. Reprints do not require permission, but please follow our syndication guidelines.
Related Research

Education & Skills
“School’s not cool”: How peer pressure can hurt boys’ education
Peer pressure and masculine norms discourage boys—especially disadvantaged ones—from visible academic effort, widening education gaps.

Education & Skills
How NEETs spend their time
How young people not in work or school spend their days—and why NEET men’s leisure time and isolation matter for norms, policy, and work.
Education & Skills
The strong, positive effects of high-dose tutoring for boys (and girls)
Boys face early, lasting education gaps. Research shows most interventions fall short—except high-dose tutoring with proven gains.