ResearchEducation & Skills, Employment
Patterns and trends in county-level sex ratios

Summary
The ratio of men to women in a population, known as the sex ratio, is associated with many social trends, including family formation. The overall U.S. sex ratio skews female, but counties in the South tend to have more women, while counties in the West and Midwest have more men. Over the last twenty years, the share of counties which are majority-male has doubled, from 24% to 48%. There are many potential reasons for this trend, but one likely cause is more women leaving rural counties for educational and employment opportunities in cities. Counties with imbalanced sex ratios may face social challenges, but this trend warrants further research.
Key takeaways
- Nationally and including all age groups, there are about 98 men per 100 women. There are more boys than girls at younger ages (because more boys than girls are born) but more women than men at older ages (because women live longer than men).
- Geographically, the South tends to have more women than men, while the West and Midwest tend to be the opposite.
- In 75% of counties, there are more men than women aged 20-39, which may have implications for family formation and the marriage market.
- The share of counties which are majority male doubled between 2003 and 2023, from 24% to 48% in 2023.
- Urban counties tend to have more women than men. For example, Brooklyn, New York, has just 91 men for every 100 women.
Nationally, there are about 98 men for every 100 women. While more boys than girls are born (about 105 boys for every 100 girls), men die, on average, earlier than women. The sex ratio, defined as the number of men per 100 women, therefore varies significantly by age, as Figure 1 shows.
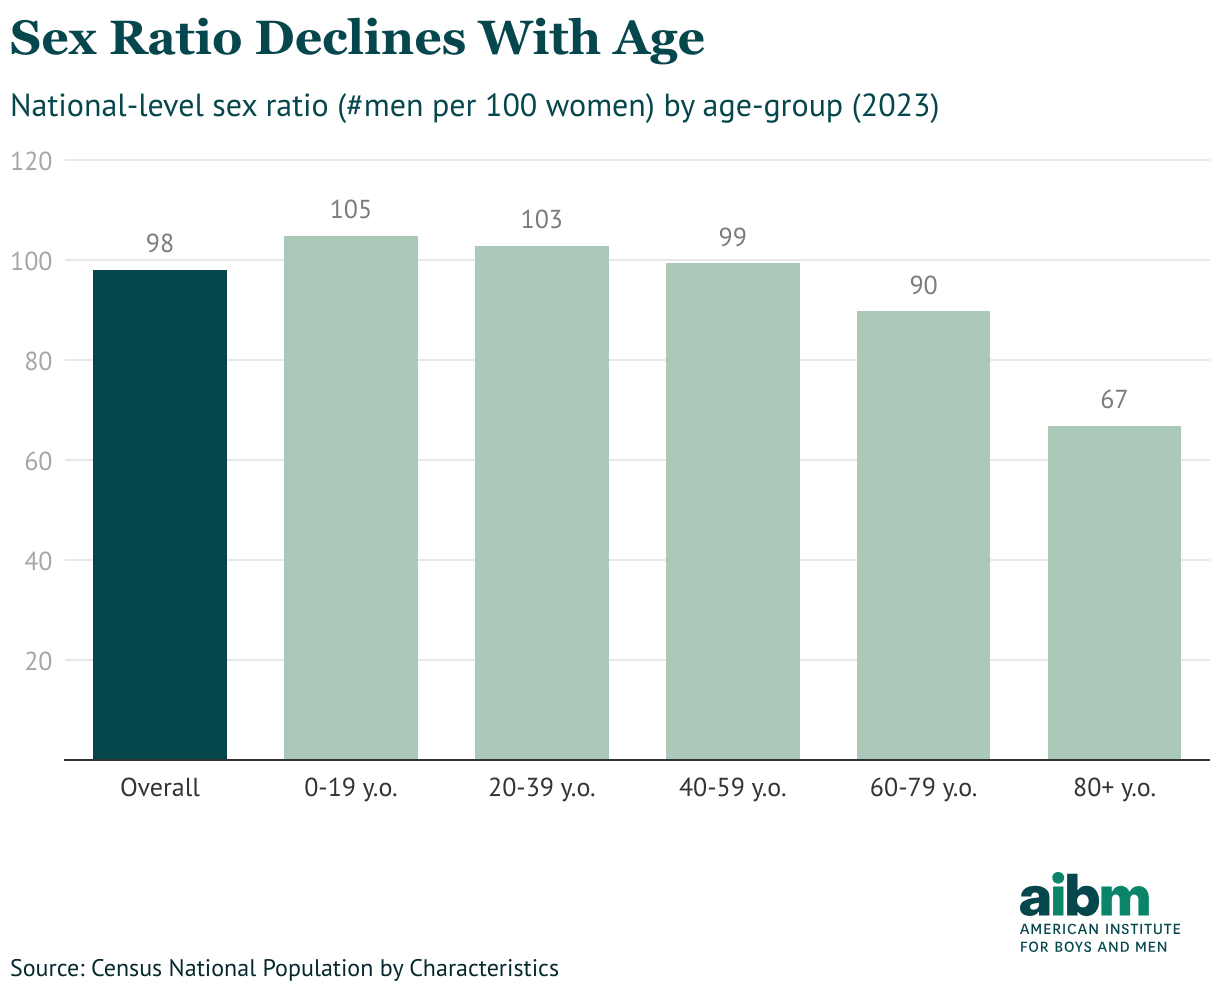
Figure 1
Skewed sex ratios within communities have been linked by scholars to a wide range of social dynamics, including crime, mortality, relationship formation and bargaining power in the marriage market.
County-level differences
While the U.S. as a whole is majority female, in 2023 the median county was about perfectly balanced at roughly 100 men per 100 women. This means that almost half of U.S. counties (48%) are majority male, as Figure 2 shows.
Counties in the Midwest and West are more likely to skew male, while those in the South and East Coast generally have more women. For example, Nye County, Nevada, has 105 men per 100 women, while Jefferson County, Alabama, has just 90 men per 100 women.
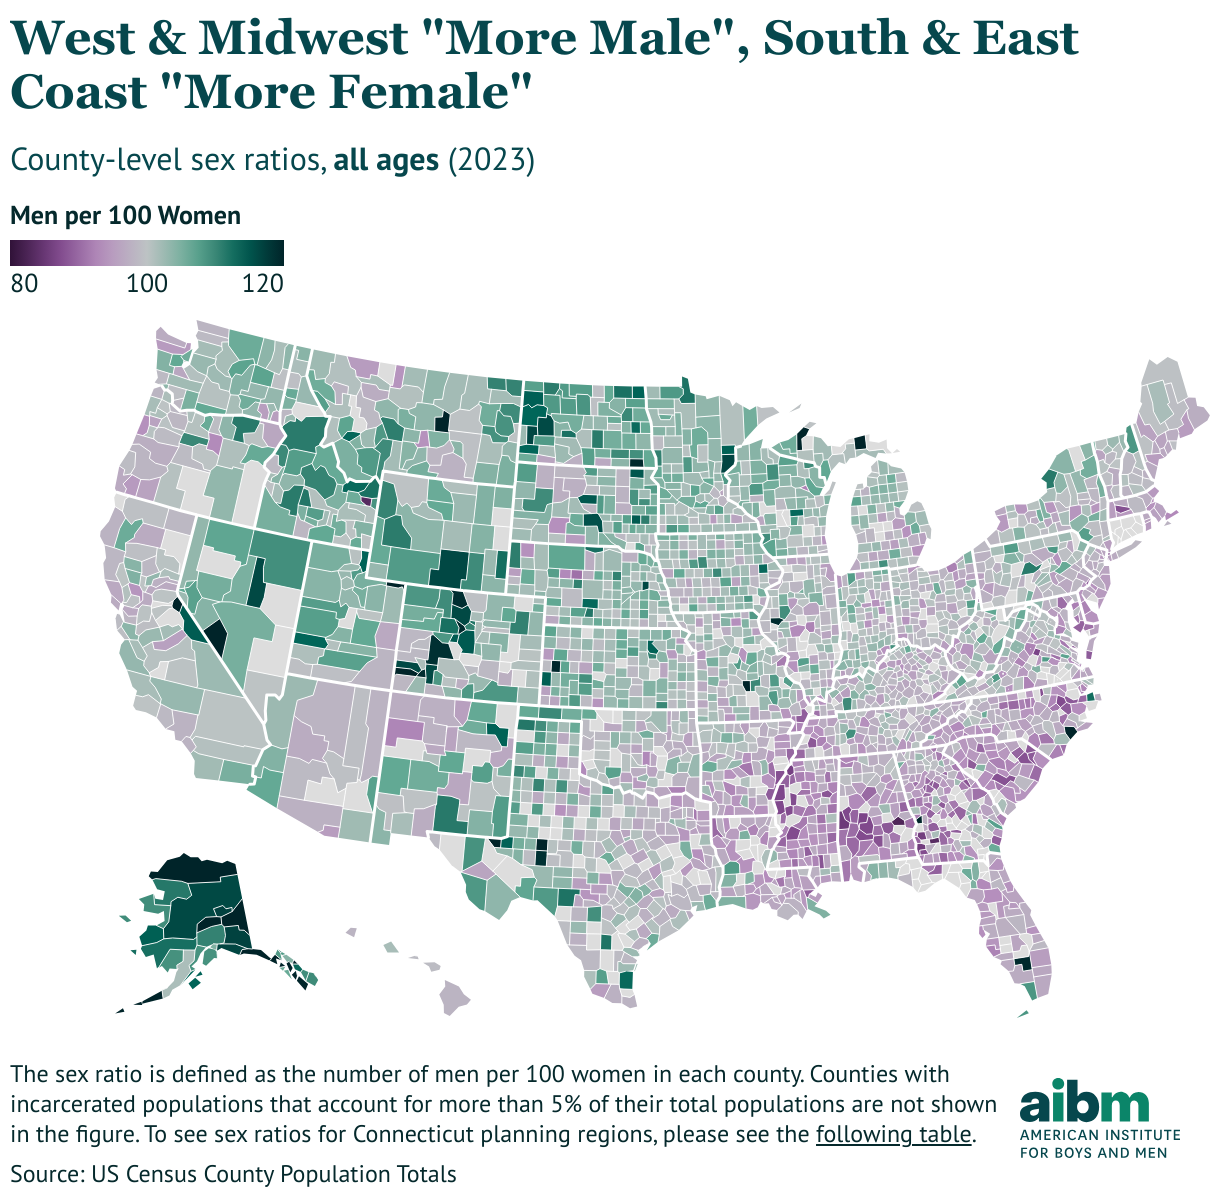
Figure 2
DATA NOTEData used in this research brief are collected from the U.S. Census Bureau. Specifically, we use the National Population estimates for national sex ratios, and the County Population Totals for county-level sex ratios. The estimates incorporate changes in births, deaths and migration. The estimates appear to be fairly robust. We use the estimates for the 2003, 2013 and 2023 county-level population totals.
One challenge when calculating sex ratios at the county level is the potentially distorting effects of a prison population. For example, Crowley County, Colorado has about 280 men for every 100 women, while Pulaski County, Georgia has only about 73 men for every 100 women. But 50% of the population of Crowley County (which hosts a correctional facility) is incarcerated. And 12% of the population of Pulaski County (which hosts a women’s prison) is also incarcerated. For this reason, we use the 2020 decennial census to collect county-level incarcerated population shares, and exclude from our main analysis counties with incarcerated shares greater than 5% of their total population.
After accounting for these outliers, we are left with 2,862 counties for the 2023 data: 2,858 of these counties have data available for the years 2023, 2013 and 2003.
Finally, you will likely notice that in our figures, Connecticut is not included. This is due to Connecticut’s change in 2022 from counties to “planning regions.” We are therefore not able to compare Connecticut’s county-level sex ratios over time; we do however show planning-region-level sex ratios for 2023 here.
These geographical differences are even more pronounced for certain age groups. Most counties are majority-male for the 20 to 39 age group, as Figure 3 shows.
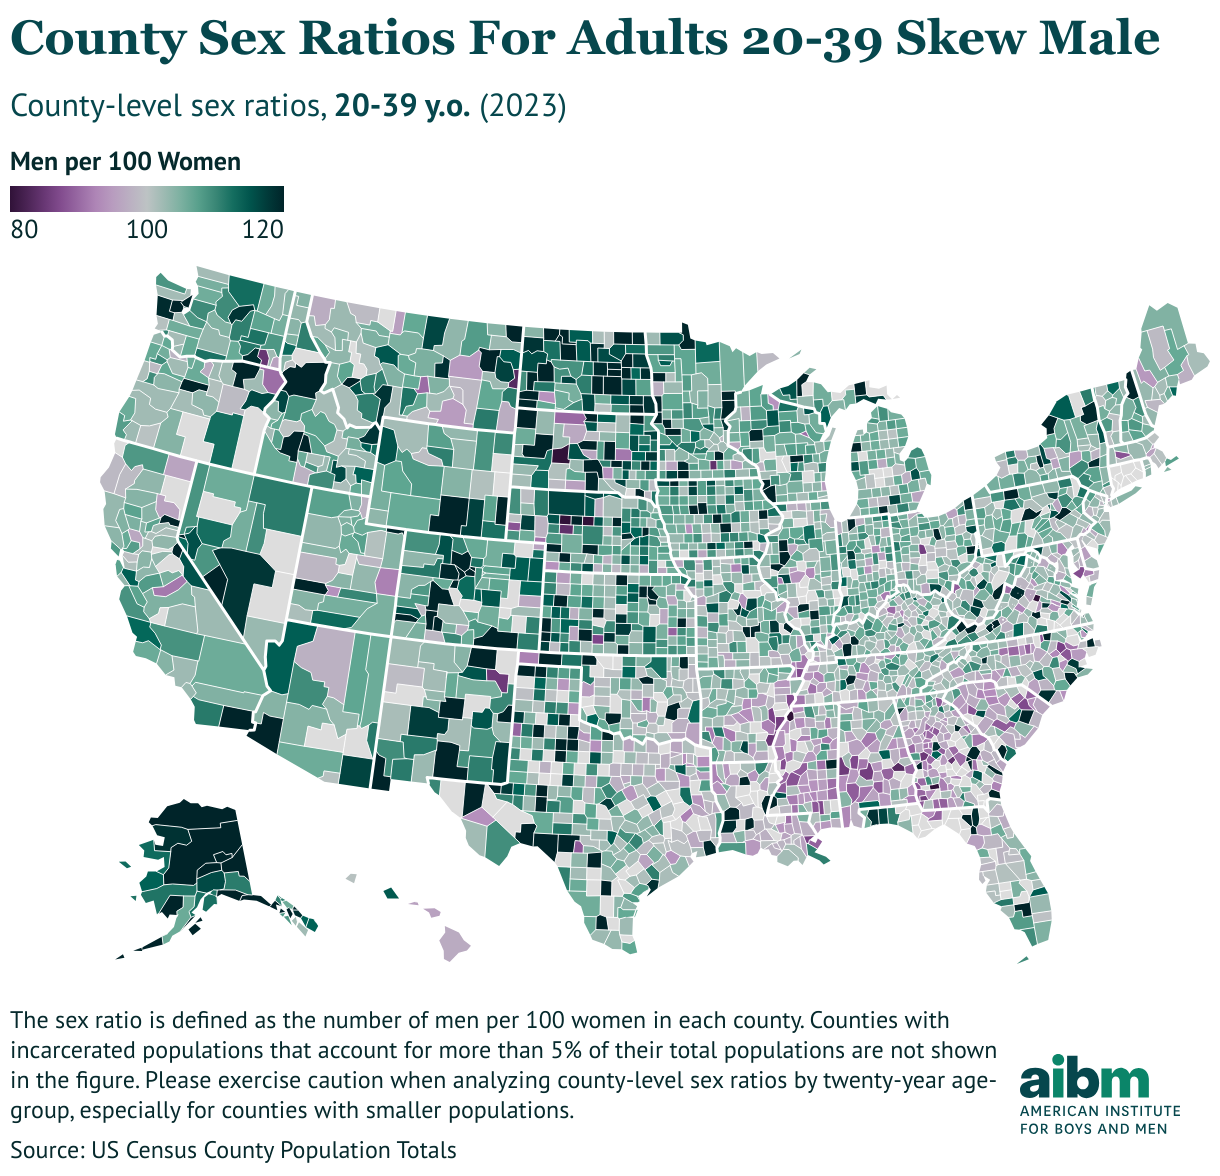
Figure 3
In 43% of counties there are 105 or more men for every 100 women in the 20-39 year age bracket; compared to just 8% of counties which are skewed in the other direction (i.e. with 95 men or fewer for every 100 women). In some counties the skew is even more pronounced: in 20% of counties there are at least 110 men aged 20 to 39 for every 100 women in the same age group.
Given that 20 to 39 is the age range in which most family formation takes place, a strong skew in the sex ratio could cause distortions in the marriage and relationship markets. If there are many more men than women in a particular community, it is likely that those women have more bargaining power in the relationship market and can be more selective when picking a partner.
In Figure 4, which allows for a search by county name, we show the sex ratios for every county, including by different age groups.
Figure 4
Time trends
Over the past twenty years, there have been some notable shifts in county-level sex ratios. From 2003 to 2023, four out of five counties became relatively more male. More than a quarter (27%) increased their male shares by at least one percentage point (the equivalent to going from parity to 104 men per 100 women). As a result, the share of majority male counties doubled from 24% in 2003 to 48% in 2023. By contrast, just 3% of counties became majority female over the same time period.
Figure 5 shows changes in the sex ratio of counties over the past twenty years.
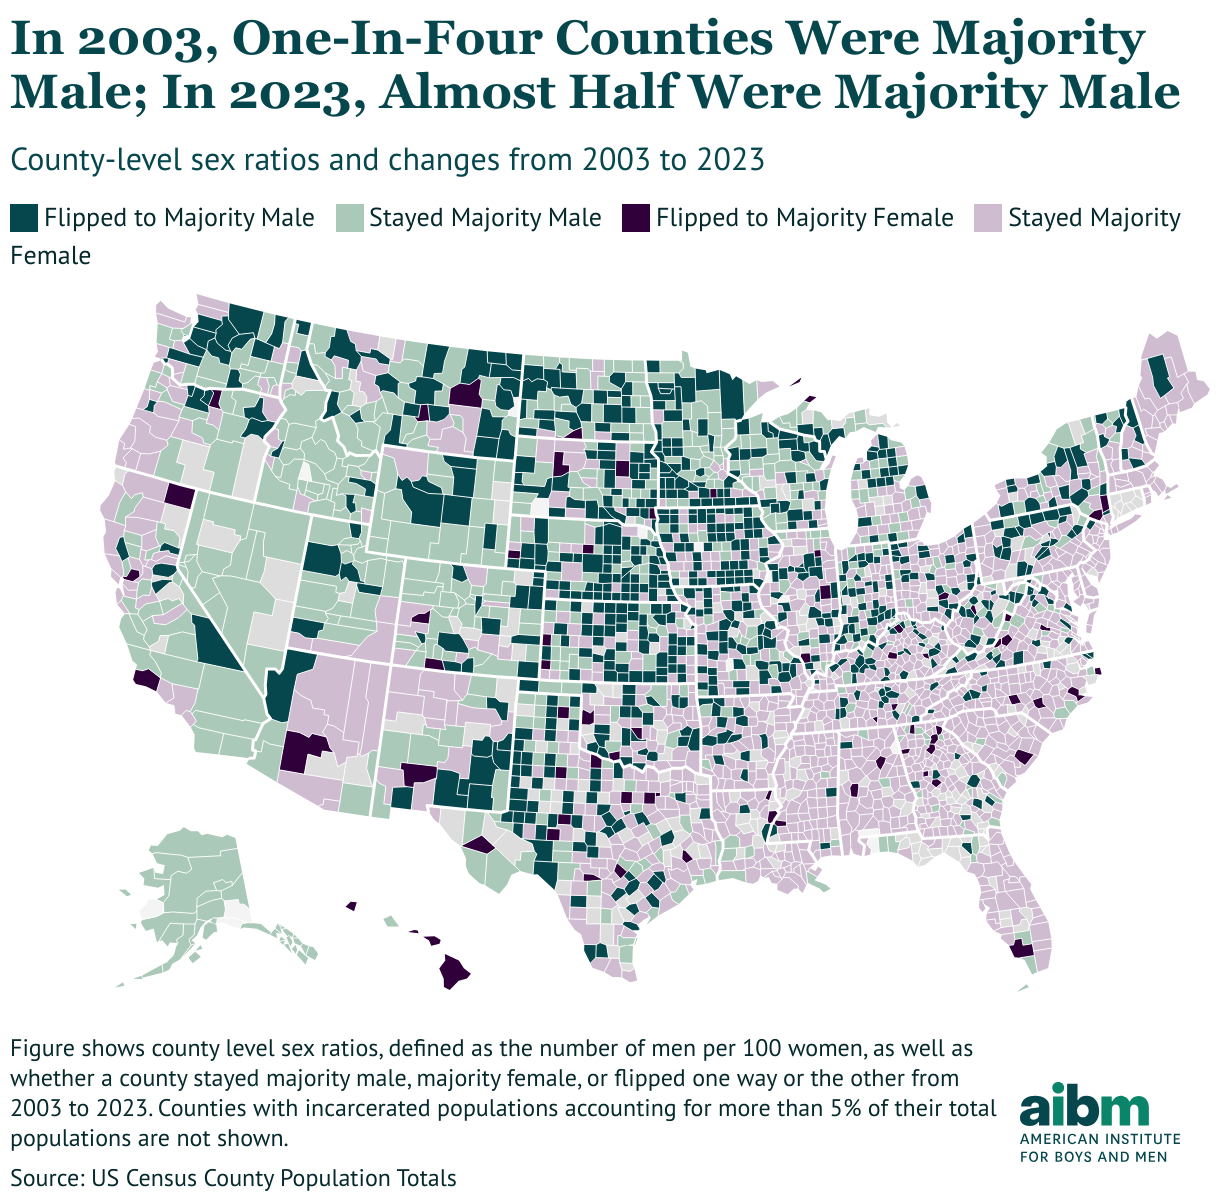
Figure 5
A county could become majority male via three types of demographic shifts:
- A decrease in both male and female population but losing fewer men than women: 47% of counties that went majority male followed this pattern.
- An increase in both the male and female population, but gaining more men than women over the period: 37% of counties that became majority male fall in this category.
- An increase in the number of men combined with a drop in the number of women: 16% of counties that become majority male saw this combination.
Of those counties that became majority male in the past twenty years, then, almost two-thirds of these counties (63%) saw a decrease in their female population. These counties are smaller on average, and there may be several contributing factors to this shift.
Potential causes and further directions
More urban counties are generally more likely to skew female. Some notable examples include Cook County, which includes Chicago and has 95 men per 100 women, as well as Philadelphia County which has 90 men per 100 women. The three densest counties, all in New York state – New York, Kings and Bronx County – also have only nine men for every ten women.
There are some exceptions to this trend: San Francisco County, for example, has a ratio of about 106 men per 100 women, likely due to its abundant tech sector. In other cities such as Houston, Phoenix and Los Angeles, the sex ratio is quite balanced. But the overall pattern is of more urban areas skewing more female, as Figure 6 shows, with a negative correlation between population density and sex ratio.
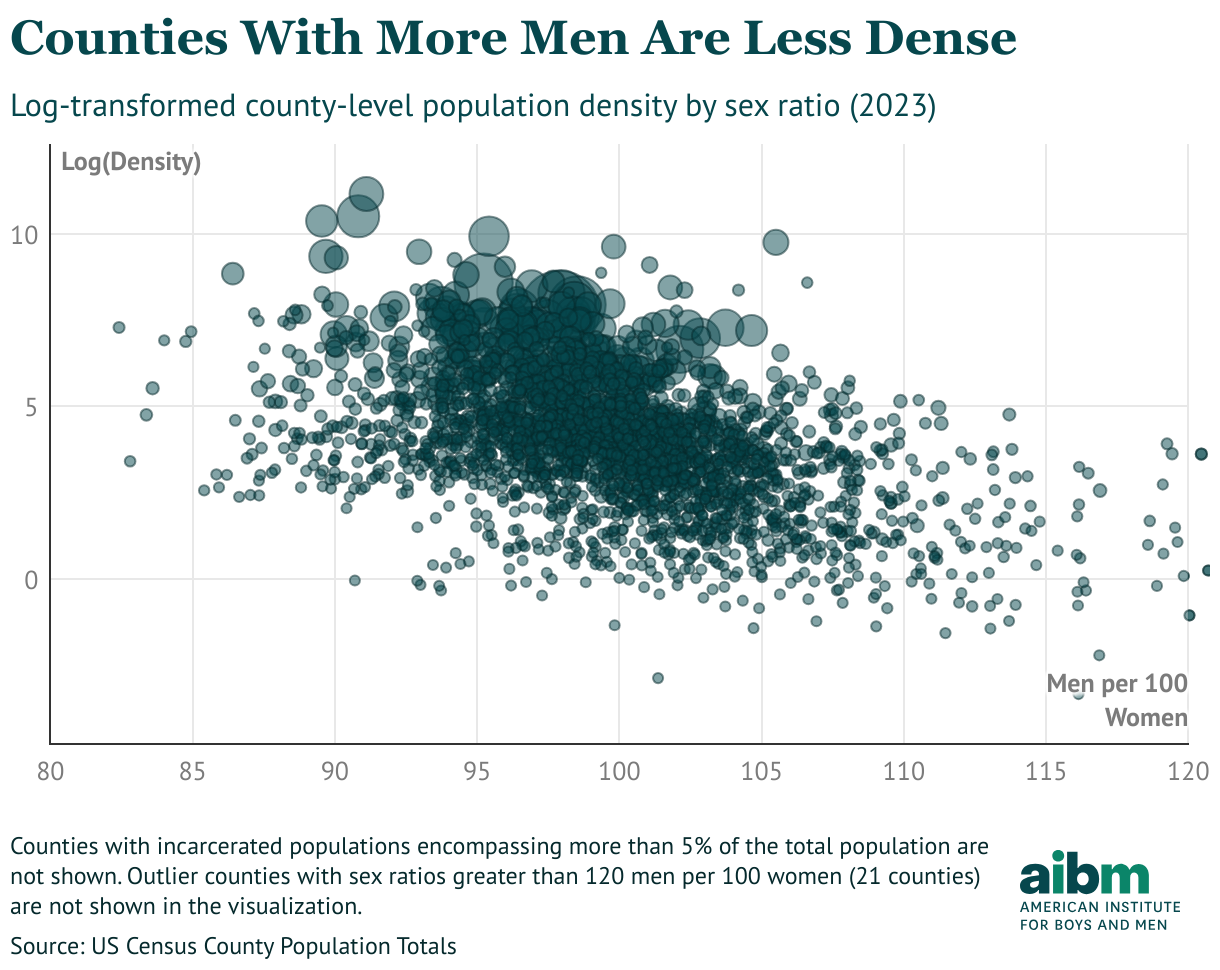
Figure 6
The concentration of women in urban counties is not limited to the United States. Several factors may be driving this trend, though more research is needed:
- Colleges are concentrated in urban areas and college attendees are increasingly female.
- Urban labor markets often offer more dynamic opportunities, particularly for those with college degrees.
- Public services may allow women to more easily combine work and family life.
If the trends outlined here continue, there will likely be a growing number of counties with male-skewed sex ratios. The greater movement of women towards more urban counties, in part because of their greater education, seems likely to continue. There are potential implications here for a number of social and economic outcomes, including family formation, but more research is needed to fully understand these implications.
Subscribe to our newsletter
Get the latest developments on the trends and issues facing boys and men.
Found our publication insightful?AIBM encourages the sharing of our publications with proper acknowledgment. Reprints do not require permission, but please follow our syndication guidelines.
Related Research

Education & Skills, Employment
“School’s not cool”: How peer pressure can hurt boys’ education
Peer pressure and masculine norms discourage boys—especially disadvantaged ones—from visible academic effort, widening education gaps.

Education & Skills, Employment
How NEETs spend their time
How young people not in work or school spend their days—and why NEET men’s leisure time and isolation matter for norms, policy, and work.
Education & Skills, Employment
The strong, positive effects of high-dose tutoring for boys (and girls)
Boys face early, lasting education gaps. Research shows most interventions fall short—except high-dose tutoring with proven gains.